CME Gr CME will release its quarterly earnings report on Wednesday, 2025-04-23. Here’s a brief overview for investors ahead of the announcement.
Analysts anticipate CME Gr to report an earnings per share (EPS) of $2.75.
The market awaits CME Gr’s announcement, with hopes high for news of surpassing estimates and providing upbeat guidance for the next quarter.
It’s important for new investors to understand that guidance can be a significant driver of stock prices.
Overview of Past Earnings
The company’s EPS beat by $0.07 in the last quarter, leading to a 0.46% increase in the share price on the following day.
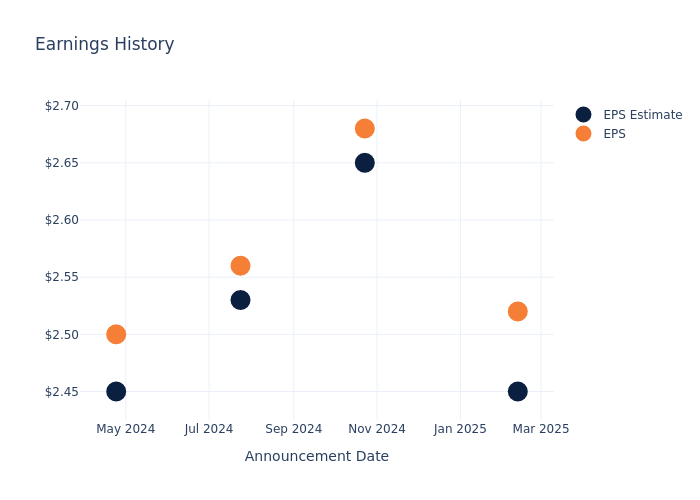
Here’s a look at CME Gr’s past performance and the resulting price change:
| Quarter | Q4 2024 | Q3 2024 | Q2 2024 | Q1 2024 |
|---|---|---|---|---|
| EPS Estimate | 2.45 | 2.65 | 2.53 | 2.45 |
| EPS Actual | 2.52 | 2.68 | 2.56 | 2.50 |
| Price Change % | 0.0% | 1.0% | 1.0% | -0.0% |
Performance of CME Gr Shares
Shares of CME Gr were trading at $260.33 as of April 21. Over the last 52-week period, shares are up 24.05%. Given that these returns are generally positive, long-term shareholders should be satisfied going into this earnings release.
Analyst Opinions on CME Gr
For investors, staying informed about market sentiments and expectations in the industry is paramount. This analysis provides an exploration of the latest insights on CME Gr.
Analysts have provided CME Gr with 12 ratings, resulting in a consensus rating of Neutral. The average one-year price target stands at $262.42, suggesting a potential 0.8% upside.
Comparing Ratings with Peers
The following analysis focuses on the analyst ratings and average 1-year price targets of Intercontinental Exchange, Moodys and S&P Global, three prominent industry players, providing insights into their relative performance expectations and market positioning.
- Analysts currently favor an Buy trajectory for Intercontinental Exchange, with an average 1-year price target of $200.0, suggesting a potential 23.17% downside.
- Analysts currently favor an Neutral trajectory for Moodys, with an average 1-year price target of $525.38, suggesting a potential 101.81% upside.
- Analysts currently favor an Outperform trajectory for S&P Global, with an average 1-year price target of $605.25, suggesting a potential 132.49% upside.
Summary of Peers Analysis
The peer analysis summary provides a snapshot of key metrics for Intercontinental Exchange, Moodys and S&P Global, illuminating their respective standings within the industry. These metrics offer valuable insights into their market positions and comparative performance.
| Company | Consensus | Revenue Growth | Gross Profit | Return on Equity |
|---|---|---|---|---|
| CME Group | Neutral | 5.98% | $1.30B | 3.16% |
| Intercontinental Exchange | Buy | 13.65% | $1.62B | 2.54% |
| Moodys | Neutral | 12.97% | $1.18B | 10.58% |
| S&P Global | Outperform | 13.96% | $2.48B | 2.62% |
Key Takeaway:
CME Group ranks in the middle among its peers for revenue growth. It is at the bottom for gross profit and return on equity.
All You Need to Know About CME Gr
Based in Chicago, CME Group operates exchanges giving investors, suppliers, and businesses the ability to trade futures and derivatives based on interest rates, equity indexes, foreign currencies, energy, metals, and commodities. The Chicago Mercantile Exchange was founded in 1898 and in 2002 completed its IPO. Since then, CME Group has consolidated parts of the industry by merging with crosstown rival CBOT Holdings in 2007 before acquiring Nymex Holdings in 2008 and NEX in 2018. In addition, the company has a 27% stake in S&P Dow Jones Indices, making the Chicago Mercantile Exchange the exclusive venue to trade and clear S&P futures contracts. Through CME’s acquisition of NEX, it also expanded into cash foreign exchange, fixed-income trading, and collateral optimization.
Financial Milestones: CME Gr’s Journey
Market Capitalization Analysis: With an elevated market capitalization, the company stands out above industry averages, showcasing substantial size and market acknowledgment.
Positive Revenue Trend: Examining CME Gr’s financials over 3 months reveals a positive narrative. The company achieved a noteworthy revenue growth rate of 5.98% as of 31 December, 2024, showcasing a substantial increase in top-line earnings. When compared to others in the Financials sector, the company faces challenges, achieving a growth rate lower than the average among peers.
Net Margin: CME Gr’s net margin is impressive, surpassing industry averages. With a net margin of 56.62%, the company demonstrates strong profitability and effective cost management.
Return on Equity (ROE): CME Gr’s financial strength is reflected in its exceptional ROE, which exceeds industry averages. With a remarkable ROE of 3.16%, the company showcases efficient use of equity capital and strong financial health.
Return on Assets (ROA): CME Gr’s ROA is below industry averages, indicating potential challenges in efficiently utilizing assets. With an ROA of 0.63%, the company may face hurdles in achieving optimal financial returns.
Debt Management: CME Gr’s debt-to-equity ratio is below the industry average. With a ratio of 0.13, the company relies less on debt financing, maintaining a healthier balance between debt and equity, which can be viewed positively by investors.
To track all earnings releases for CME Gr visit their earnings calendar on our site.
This article was generated by Benzinga’s automated content engine and reviewed by an editor.
© 2025 Benzinga.com. Benzinga does not provide investment advice. All rights reserved.