Fastenal FAST is preparing to release its quarterly earnings on Friday, 2025-04-11. Here’s a brief overview of what investors should keep in mind before the announcement.
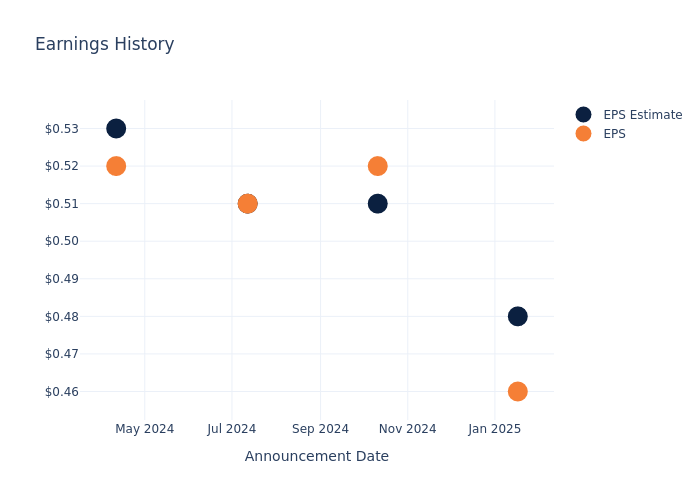
Analysts expect Fastenal to report an earnings per share (EPS) of $0.53.
The market awaits Fastenal’s announcement, with hopes high for news of surpassing estimates and providing upbeat guidance for the next quarter.
It’s important for new investors to understand that guidance can be a significant driver of stock prices.
Earnings Track Record
Last quarter the company missed EPS by $0.02, which was followed by a 0.0% drop in the share price the next day.
Here’s a look at Fastenal’s past performance and the resulting price change:
| Quarter | Q4 2024 | Q3 2024 | Q2 2024 | Q1 2024 |
|---|---|---|---|---|
| EPS Estimate | 0.48 | 0.51 | 0.51 | 0.53 |
| EPS Actual | 0.46 | 0.52 | 0.51 | 0.52 |
| Price Change % | 2.0% | 10.0% | 2.0% | 1.0% |
Tracking Fastenal’s Stock Performance
Shares of Fastenal were trading at $76.47 as of April 09. Over the last 52-week period, shares are up 8.05%. Given that these returns are generally positive, long-term shareholders are likely bullish going into this earnings release.
Analyst Insights on Fastenal
Understanding market sentiments and expectations within the industry is crucial for investors. This analysis delves into the latest insights on Fastenal.
Analysts have given Fastenal a total of 1 ratings, with the consensus rating being Neutral. The average one-year price target is $82.0, indicating a potential 7.23% upside.
Comparing Ratings with Competitors
This comparison focuses on the analyst ratings and average 1-year price targets of W.W. Grainger, United Rentals and Ferguson Enterprises, three major players in the industry, shedding light on their relative performance expectations and market positioning.
- Analysts currently favor an Neutral trajectory for W.W. Grainger, with an average 1-year price target of $1106.0, suggesting a potential 1346.32% upside.
- Analysts currently favor an Buy trajectory for United Rentals, with an average 1-year price target of $797.09, suggesting a potential 942.36% upside.
- Analysts currently favor an Outperform trajectory for Ferguson Enterprises, with an average 1-year price target of $189.92, suggesting a potential 148.36% upside.
Insights: Peer Analysis
The peer analysis summary provides a snapshot of key metrics for W.W. Grainger, United Rentals and Ferguson Enterprises, illuminating their respective standings within the industry. These metrics offer valuable insights into their market positions and comparative performance.
| Company | Consensus | Revenue Growth | Gross Profit | Return on Equity |
|---|---|---|---|---|
| Fastenal | Neutral | 3.75% | $818.20M | 7.27% |
| W.W. Grainger | Neutral | 5.90% | $1.68B | 13.85% |
| United Rentals | Buy | 9.84% | $1.64B | 8.01% |
| Ferguson Enterprises | Outperform | 2.98% | $2.04B | 4.95% |
Key Takeaway:
Fastenal ranks in the middle for consensus rating. It is at the bottom for revenue growth. It is at the top for gross profit. It is at the bottom for return on equity.
Unveiling the Story Behind Fastenal
Fastenal opened its first fastener store in 1967 in Winona, Minnesota. Since then, it has greatly expanded its footprint as well as its products and services. Today, Fastenal serves its 400,000 active customers through approximately 1,600 branches, over 2,000 on-site locations, and 15 distribution centers. Since 1993, the company has added other product categories, but fasteners remain its largest category at about 30%-35% of sales. Fastenal also offers customers supply chain solutions, such as vending and vendor-managed inventory.
Fastenal: A Financial Overview
Market Capitalization Analysis: The company’s market capitalization is above the industry average, indicating that it is relatively larger in size compared to peers. This may suggest a higher level of investor confidence and market recognition.
Positive Revenue Trend: Examining Fastenal’s financials over 3 months reveals a positive narrative. The company achieved a noteworthy revenue growth rate of 3.75% as of 31 December, 2024, showcasing a substantial increase in top-line earnings. As compared to competitors, the company encountered difficulties, with a growth rate lower than the average among peers in the Industrials sector.
Net Margin: Fastenal’s net margin is impressive, surpassing industry averages. With a net margin of 14.37%, the company demonstrates strong profitability and effective cost management.
Return on Equity (ROE): Fastenal’s ROE stands out, surpassing industry averages. With an impressive ROE of 7.27%, the company demonstrates effective use of equity capital and strong financial performance.
Return on Assets (ROA): Fastenal’s financial strength is reflected in its exceptional ROA, which exceeds industry averages. With a remarkable ROA of 5.56%, the company showcases efficient use of assets and strong financial health.
Debt Management: With a below-average debt-to-equity ratio of 0.13, Fastenal adopts a prudent financial strategy, indicating a balanced approach to debt management.
To track all earnings releases for Fastenal visit their earnings calendar on our site.
This article was generated by Benzinga’s automated content engine and reviewed by an editor.
© 2025 Benzinga.com. Benzinga does not provide investment advice. All rights reserved.