Financial giants have made a conspicuous bullish move on Teva Pharmaceutical Indus. Our analysis of options history for Teva Pharmaceutical Indus TEVA revealed 8 unusual trades.
Delving into the details, we found 62% of traders were bullish, while 37% showed bearish tendencies. Out of all the trades we spotted, 5 were puts, with a value of $155,460, and 3 were calls, valued at $189,620.
Projected Price Targets
After evaluating the trading volumes and Open Interest, it’s evident that the major market movers are focusing on a price band between $15.0 and $22.0 for Teva Pharmaceutical Indus, spanning the last three months.
Analyzing Volume & Open Interest
Looking at the volume and open interest is an insightful way to conduct due diligence on a stock.
This data can help you track the liquidity and interest for Teva Pharmaceutical Indus’s options for a given strike price.
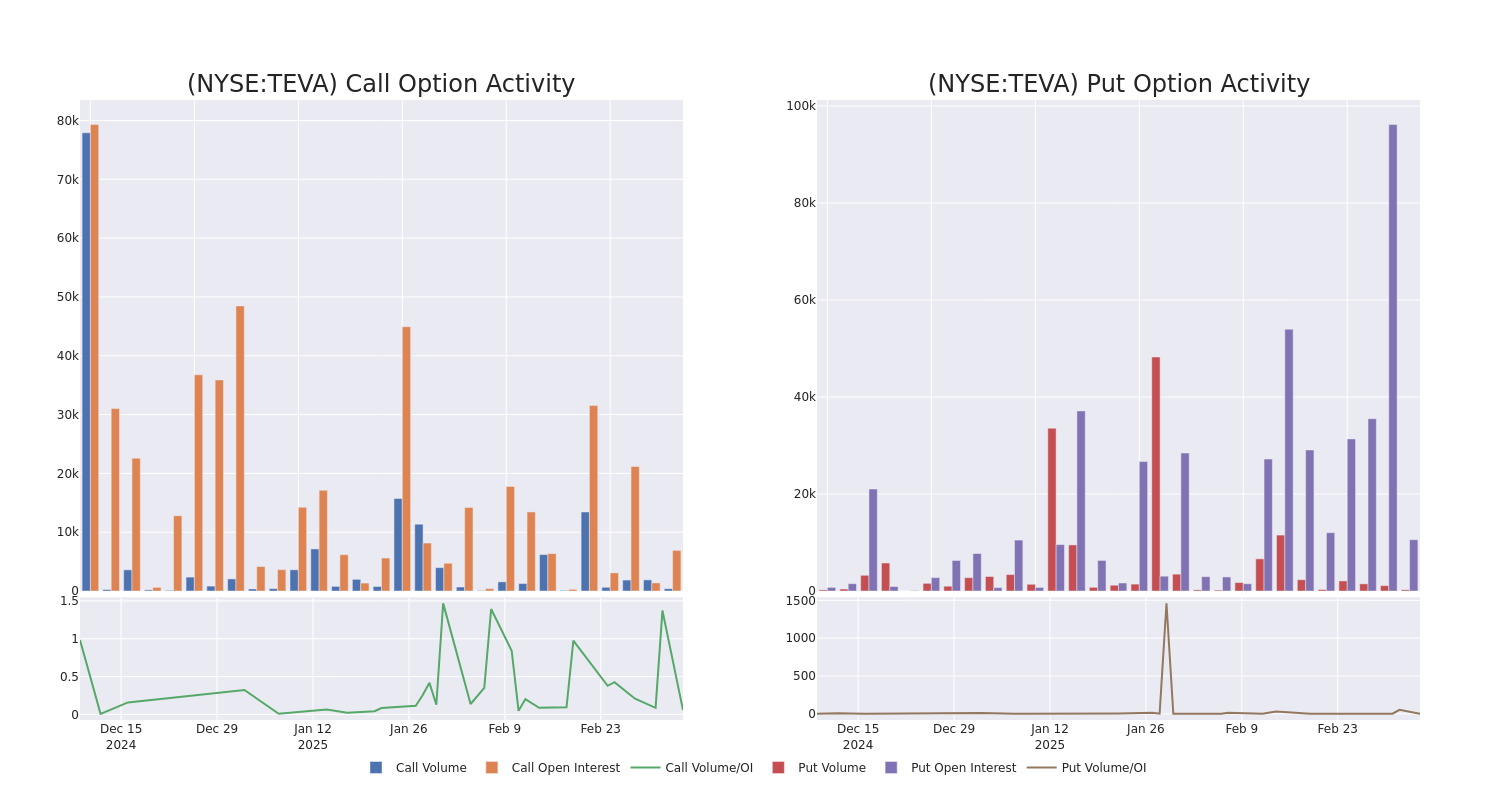
Below, we can observe the evolution of the volume and open interest of calls and puts, respectively, for all of Teva Pharmaceutical Indus’s whale activity within a strike price range from $15.0 to $22.0 in the last 30 days.
Teva Pharmaceutical Indus Call and Put Volume: 30-Day Overview
Largest Options Trades Observed:
| Symbol | PUT/CALL | Trade Type | Sentiment | Exp. Date | Ask | Bid | Price | Strike Price | Total Trade Price | Open Interest | Volume |
|---|---|---|---|---|---|---|---|---|---|---|---|
| TEVA | CALL | SWEEP | BULLISH | 01/15/27 | $3.95 | $3.55 | $3.9 | $15.00 | $77.6K | 3.0K | 1 |
| TEVA | CALL | TRADE | BULLISH | 01/15/27 | $3.9 | $3.6 | $3.88 | $15.00 | $65.9K | 3.0K | 201 |
| TEVA | CALL | TRADE | BULLISH | 01/15/27 | $2.46 | $2.06 | $2.3 | $20.00 | $45.9K | 3.8K | 200 |
| TEVA | PUT | TRADE | BULLISH | 01/16/26 | $7.55 | $6.9 | $6.91 | $22.00 | $34.5K | 1.4K | 40 |
| TEVA | PUT | TRADE | BULLISH | 06/20/25 | $6.8 | $6.75 | $6.75 | $22.00 | $33.7K | 9.1K | 90 |
About Teva Pharmaceutical Indus
Teva Pharmaceutical Industries, based in Israel, is the leading generic drug manufacturer in the world. Teva derives half of its sales from North America and makes up a high-single-digit percentage of the total number of generic prescriptions in the US. It also has a significant presence in Europe, Japan, Russia, and Israel. Besides generics, Teva has a portfolio of innovative medicines and biosimilars in three main therapeutic areas: the central nervous system with Copaxone, Ajovy, and Austedo; respiratory with Qvar and ProAir; and oncology with Truxima, Herzuma, and Bendeka/Treanda. Teva also sells active pharmaceutical ingredients, offers contract manufacturing services, and owns Anda, a US-based generic and specialty drug distributor.
After a thorough review of the options trading surrounding Teva Pharmaceutical Indus, we move to examine the company in more detail. This includes an assessment of its current market status and performance.
Present Market Standing of Teva Pharmaceutical Indus
- Currently trading with a volume of 4,001,868, the TEVA’s price is down by -1.37%, now at $15.14.
- RSI readings suggest the stock is currently may be approaching oversold.
- Anticipated earnings release is in 61 days.
Professional Analyst Ratings for Teva Pharmaceutical Indus
Over the past month, 1 industry analysts have shared their insights on this stock, proposing an average target price of $20.0.
Unusual Options Activity Detected: Smart Money on the Move
Benzinga Edge’s Unusual Options board spots potential market movers before they happen. See what positions big money is taking on your favorite stocks. Click here for access.
* An analyst from B of A Securities has decided to maintain their Buy rating on Teva Pharmaceutical Indus, which currently sits at a price target of $20.
Trading options involves greater risks but also offers the potential for higher profits. Savvy traders mitigate these risks through ongoing education, strategic trade adjustments, utilizing various indicators, and staying attuned to market dynamics. Keep up with the latest options trades for Teva Pharmaceutical Indus with Benzinga Pro for real-time alerts.
Momentum46.96
Growth78.29
Quality45.39
Value32.39
Market News and Data brought to you by Benzinga APIs
© 2025 Benzinga.com. Benzinga does not provide investment advice. All rights reserved.