The number of stocks advancing surpassed those declining among the S&P 500 index constituents on Friday after a 14-session streak of negative market breadth. Now, Ryan Detrick, chief market strategist at Carson Global, has predicted gains ahead, citing historical market data.
What Happened: Risk appetite returned to Wall Street on Friday, leading to a sigh of relief from investors. Detrick highlighted how the markets have performed after previous such streaks ended.
According to the data shared by him, over the past four decades, there have been only five other instances where the S&P 500 experienced a period of ten or more consecutive days of negative breadth. Additionally, the index was higher by an average of 17.9% a year later after all five times.
The market breadth turned positive with 89% of the stocks rising on Friday as compared to only 4% on Wednesday. This divergence also led the index to be higher a year later by at least 92.3% of the time since 1985.
Why It Matters: The Personal Consumption Expenditure (PCE) price index, the Fed’s preferred inflation gauge, rose 2.4% year-over-year, below the anticipated 2.5%. Core PCE, which excludes volatile food and energy prices, also undershot expectations, climbing 2.8% instead of the projected 2.9%.
This unexpected cooling of inflation sparked a jubilant rally across all major indices on Friday. The S&P 500 surged 1.09%, with every sector contributing to the gains. Investors cheered the reprieve from persistent inflationary pressures.
The real estate sector led the charge, experiencing a sharp rebound after being particularly hard-hit by the Fed’s recent hawkish stance. Small-cap stocks, represented by the Russell 2000, also posted strong gains of 0.94%, buoyed by a significant recovery in regional banks.
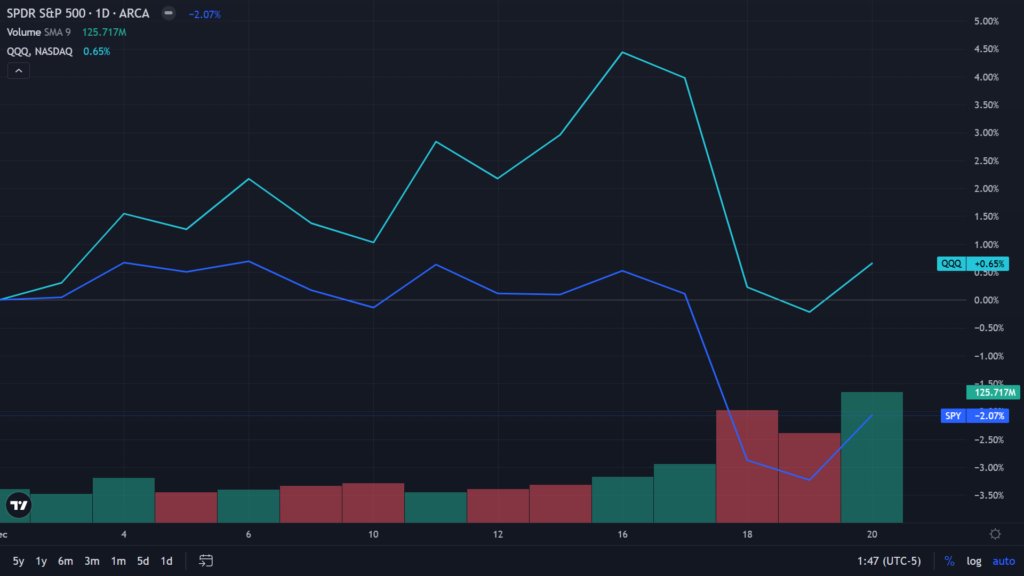
Price Action: The 14-day long streak entailing the trading days spanning from market close on Nov. 29 to Dec. 19, saw the SPDR S&P 500 ETF Trust SPY down by 2.07% and the Invesco QQQ Trust ETF QQQ up by 0.65%, according to Benzinga Pro data. On Friday, SPY advanced 1.20% and QQQ ended 0.87% higher.

Over the last month, the S&P 500 index is down by 0.94%, but year-to-date, it is up 25.05%.
The Nasdaq 100 index, on the other hand, is 2.33% over the last month and 28.68% year-to-date.
Read Next:
Image generated using Midjourney
Market News and Data brought to you by Benzinga APIs
© 2024 Benzinga.com. Benzinga does not provide investment advice. All rights reserved.


