With Donald Trump clinching a second term in the 2024 U.S. presidential election, markets are turning their attention to his potential impact on the economy and markets.
While past performance doesn’t guarantee future results, it can still provide valuable insights for investors looking for clues about what to expect from the new administration.
Here’s a detailed look at how the 11 S&P 500 sectors fared during Trump’s first term.
Although Trump wasn’t sworn in as president until January 2017, financial markets began reacting to his potential policies immediately after his election.
Trump’s first term, which spanned from Nov. 8, 2016 — the day he won against Hillary Clinton — to Nov. 3, 2020 – when he lost versus Joe Biden — brought varied performances across S&P 500 sectors.
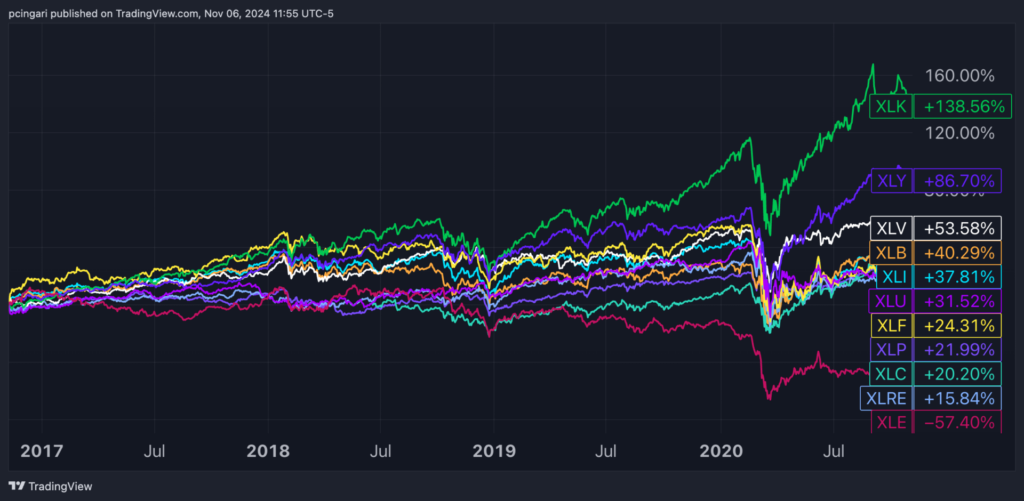
Technology and consumer discretionary sectors led the rally, while energy was the clear laggard, with the only negative return among sectors over those four years.
Tech stocks were buoyed by the spectacular rise of Magnificent Seven giants. An equally weighted basket of Microsoft Corp. MSFT, Apple Inc. AAPL, NVIDIA Corp. NVDA, Alphabet Inc. GOOG GOOGL, Amazon.com Inc. AMZN, Meta Platforms Inc. META and Tesla, Inc. TSLA delivered a remarkable 380% return from November 2016 to November 2020. That return is nearly double the performance of the Magnificent Seven during Biden’s term.
Regarding the energy sector’s poor performance, that wasn’t solely a result of the COVID-19 pandemic-driven oil price collapse.
Despite Trump’s pro-fossil-fuel policies, energy stocks faced persistent headwinds throughout his term, even before 2020, with the global shift toward renewables putting continuous pressure on traditional oil and gas investments.
Surprisingly to many, solar stocks — tracked by the Invesco Solar ETF TAN — were among the top-performing industries during Trump’s first presidency, soaring by an impressive 267% between November 2016 and November 2020.
Below is a table and chart showing the performance of S&P 500 sectors under Trump’s first term.
| Sector ETF | Performance Nov. 8, 2016 – Nov. 3, 2020 |
|---|---|
| Technology Select Sector SPDR Fund XLK | +138.56% |
| Consumer Discretionary Select Sector SPDR Fund XLY | +86.70% |
| Health Care Select Sector SPDR Fund XLV | +53.58% |
| Materials Select Sector SPDR Fund XLB | +40.29% |
| Industrial Select Sector SPDR Fund XLI | +37.81% |
| Utilities Select Sector SPDR Fund XLU | +31.52% |
| Financial Select Sector SPDR Fund XLF | +24.31% |
| Consumer Staples Select Sector SPDR Fund XLP | +21.99% |
| Communication Services Select Sector SPDR Fund XLC | +20.20% |
| Real Estate Select Sector SPDR Fund XLRE | +15.84% |
| Energy Select Sector SPDR Fund XLE | -57.40% |

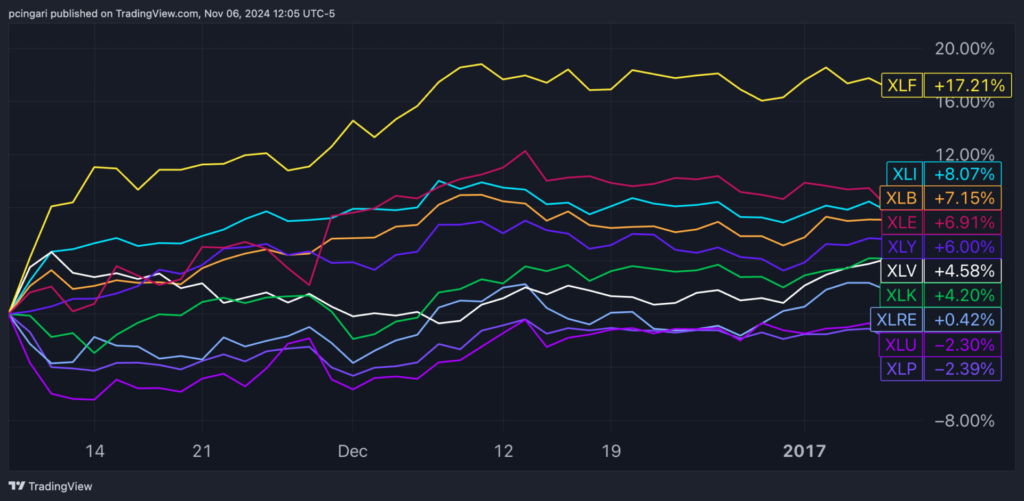
In the first three months following Trump’s 2016 election, financials stocks saw significant gains.
The Financial Select Sector SPDR Fund (XLF) rose by 17.2% between Nov. 8, 2016, and Jan. 10, 2017, outpacing all other sectors. The rally was driven by anticipation of deregulation and tax cuts, which boosted investor confidence in banks and other financial stocks.
Conversely, consumer staples and utilities — traditionally defensive sectors — were the weakest performers in that initial period, with losses of 2.39% and 2.3%, respectively.
| Sector | Return (Nov. 8, 2016 – Jan. 10, 2017) |
|---|---|
| Financials (XLF) | +17.21% |
| Industrials (XLI) | +8.07% |
| Materials (XLB) | +7.15% |
| Energy (XLE) | +6.91% |
| Consumer Discretionary (XLY) | +6.00% |
| Health Care (XLV) | +4.58% |
| Technology (XLK) | +4.20% |
| Real Estate (XLRE) | +0.42% |
| Utilities (XLU) | -2.30% |
| Consumer Staples (XLP) | -2.39% |

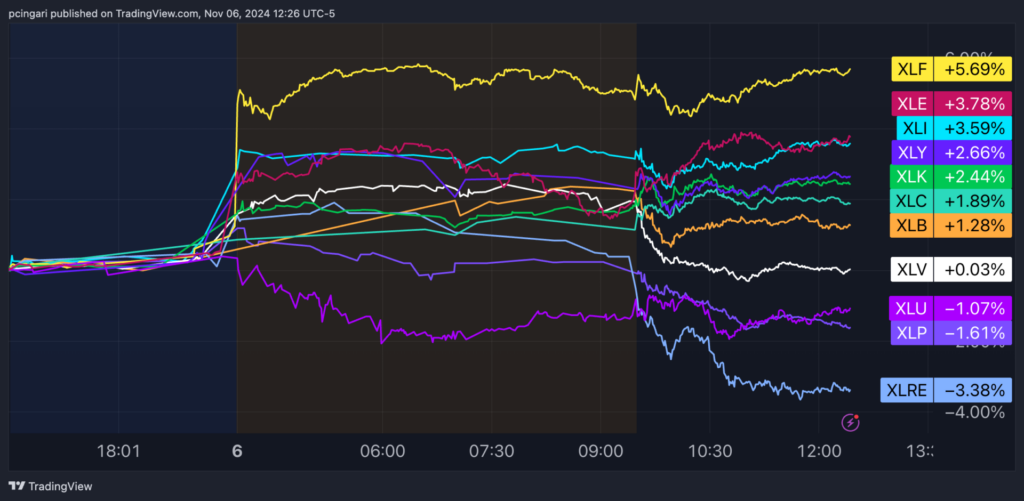
On November 6, 2024, the day after Trump’s re-election was confirmed, market activity showed a familiar pattern with financials and industrials posting the strongest gains.
Financials climbed by 5.6%, followed by energy and industrial, each more than 3.5%, suggesting renewed optimism for deregulation and potential infrastructure investment as investors previously had in the first three months following his election in 2016.
| S&P 500 Sector ETF | % Change (Nov. 6, 2024) |
|---|---|
| Financials (XLF) | +5.7% |
| Energy (XLE) | +3.8% |
| Industrials (XLI) | +3.6% |
| Consumer Discretionary (XLY) | +2.6% |
| Technology (XLK) | +2.4% |
| Communications (XLC) | +1.9% |
| Materials (XLB) | +1.3% |
| Health Care (XLV) | +0.0% |
| Utilities (XLU) | -1.1% |
| Consumer Staples (XLP) | -1.6% |
| Real Estate (XLRE) | -3.4% |

Trump’s return to the White House could bring back some familiar market dynamics, but the economic and geopolitical landscape in 2024 is notably different from 2016.
Investors should be prepared for a mix of potential tailwinds and headwinds that may shape sector performance in unique ways.
Trump’s expected emphasis on tax cuts, deregulation and support for traditional energy sources could once again boost sectors like financials, industrials and consumer discretionary. Financial stocks, in particular, might benefit from any renewed push to ease regulatory restrictions, while industrials could get a lift from a possible infrastructure spending package.
As in his first term, Trump’s focus on “America First” policies could support domestic manufacturing and sectors tied to infrastructure, including industrials and materials.
Trump’s pro-fossil-fuel stance could give the energy sector some breathing room. Traditional energy companies may benefit if there’s a shift in focus back toward oil and gas, though this will depend on global energy market dynamics.
Global trade dynamics have shifted significantly since Trump’s first term, with ongoing tensions between the U.S. and China.
If Trump reintroduces tariffs on Chinese imports, it could impact tech and industrials sectors, which rely on international supply chains and components.
Last but not least, even if Trump policies seem to prioritize fossil fuels, the private sector’s commitment to renewables could still drive growth in solar and clean energy stocks.
Read Now:
Photo: Image created using Shutterstock images
© 2024 Benzinga.com. Benzinga does not provide investment advice. All rights reserved.
