Vertiv Hldgs VRT is preparing to release its quarterly earnings on Wednesday, 2024-10-23. Here’s a brief overview of what investors should keep in mind before the announcement.
Analysts expect Vertiv Hldgs to report an earnings per share (EPS) of $0.69.
Anticipation surrounds Vertiv Hldgs’s announcement, with investors hoping to hear about both surpassing estimates and receiving positive guidance for the next quarter.
New investors should understand that while earnings performance is important, market reactions are often driven by guidance.
Earnings Track Record
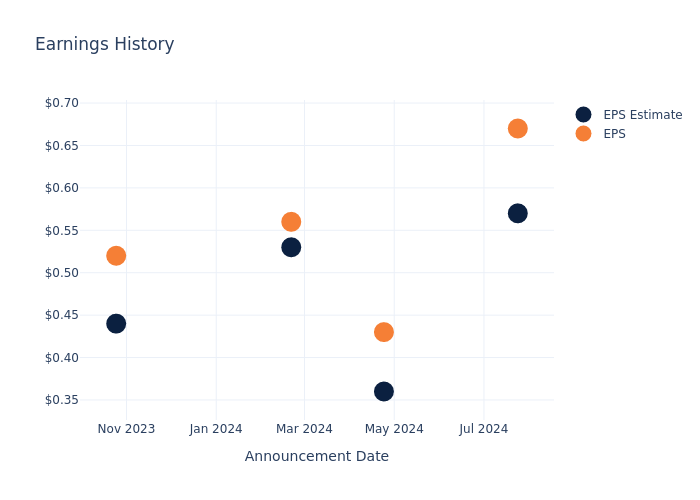
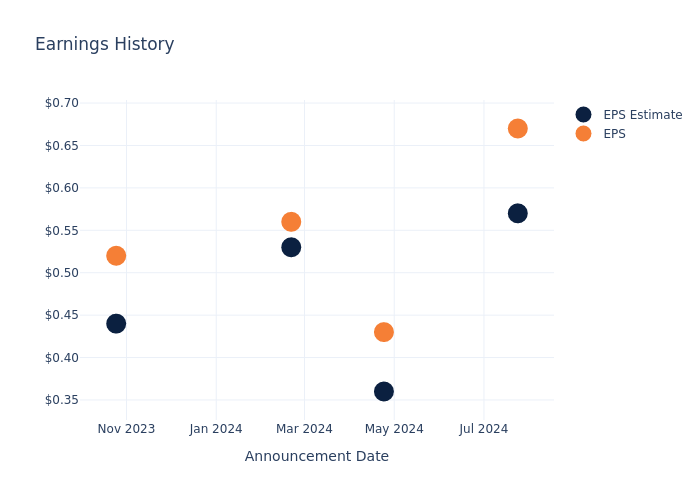
In the previous earnings release, the company beat EPS by $0.10, leading to a 2.68% drop in the share price the following trading session.
Here’s a look at Vertiv Hldgs’s past performance and the resulting price change:
| Quarter | Q2 2024 | Q1 2024 | Q4 2023 | Q3 2023 |
|---|---|---|---|---|
| EPS Estimate | 0.57 | 0.36 | 0.53 | 0.44 |
| EPS Actual | 0.67 | 0.43 | 0.56 | 0.52 |
| Price Change % | -3.0% | 7.000000000000001% | 7.000000000000001% | -7.000000000000001% |

Market Performance of Vertiv Hldgs’s Stock
Shares of Vertiv Hldgs were trading at $112.11 as of October 21. Over the last 52-week period, shares are up 204.6%. Given that these returns are generally positive, long-term shareholders are likely bullish going into this earnings release.
Analysts’ Perspectives on Vertiv Hldgs
Understanding market sentiments and expectations within the industry is crucial for investors. This analysis delves into the latest insights on Vertiv Hldgs.
Vertiv Hldgs has received a total of 9 ratings from analysts, with the consensus rating as Outperform. With an average one-year price target of $111.0, the consensus suggests a potential 0.99% downside.
Peer Ratings Overview
The below comparison of the analyst ratings and average 1-year price targets of AMETEK, Rockwell Automation and Hubbell, three prominent players in the industry, gives insights for their relative performance expectations and market positioning.
- For AMETEK, analysts project an Buy trajectory, with an average 1-year price target of $191.5, indicating a potential 70.81% upside.
- As per analysts’ assessments, Rockwell Automation is favoring an Outperform trajectory, with an average 1-year price target of $274.82, suggesting a potential 145.13% upside.
- The consensus outlook from analysts is an Neutral trajectory for Hubbell, with an average 1-year price target of $424.0, indicating a potential 278.2% upside.
Snapshot: Peer Analysis
The peer analysis summary presents essential metrics for AMETEK, Rockwell Automation and Hubbell, unveiling their respective standings within the industry and providing valuable insights into their market positions and comparative performance.
| Company | Consensus | Revenue Growth | Gross Profit | Return on Equity |
|---|---|---|---|---|
| Vertiv Hldgs | Outperform | 12.61% | $741.20M | 12.15% |
| AMETEK | Buy | 5.39% | $624.41M | 3.71% |
| Rockwell Automation | Outperform | -8.40% | $794.80M | 6.72% |
| Hubbell | Neutral | 6.34% | $508.70M | 7.13% |
Key Takeaway:
Vertiv Hldgs ranks highest in Revenue Growth among its peers. It also leads in Gross Profit. However, it falls behind in Consensus rating and Return on Equity.
All You Need to Know About Vertiv Hldgs
Vertiv Holdings Co brings together hardware, software, analytics and ongoing services to ensure its customers vital applications run continuously, perform optimally and grow with their business needs. The company solves the important challenges faced by data centers, communication networks and commercial and industrial facilities with a portfolio of power, cooling and IT infrastructure solutions and services that extends from the cloud to the edge of the network. Its services include critical power, thermal management, racks and enclosures, monitoring and management, and other services. Its three business segments include the Americas, Asia Pacific; and Europe, Middle East & Africa.
Breaking Down Vertiv Hldgs’s Financial Performance
Market Capitalization Analysis: The company’s market capitalization surpasses industry averages, showcasing a dominant size relative to peers and suggesting a strong market position.
Revenue Growth: Vertiv Hldgs’s revenue growth over a period of 3 months has been noteworthy. As of 30 June, 2024, the company achieved a revenue growth rate of approximately 12.61%. This indicates a substantial increase in the company’s top-line earnings. As compared to its peers, the revenue growth lags behind its industry peers. The company achieved a growth rate lower than the average among peers in Industrials sector.
Net Margin: The company’s net margin is a standout performer, exceeding industry averages. With an impressive net margin of 9.12%, the company showcases strong profitability and effective cost control.
Return on Equity (ROE): Vertiv Hldgs’s financial strength is reflected in its exceptional ROE, which exceeds industry averages. With a remarkable ROE of 12.15%, the company showcases efficient use of equity capital and strong financial health.
Return on Assets (ROA): Vertiv Hldgs’s financial strength is reflected in its exceptional ROA, which exceeds industry averages. With a remarkable ROA of 2.27%, the company showcases efficient use of assets and strong financial health.
Debt Management: With a high debt-to-equity ratio of 2.03, Vertiv Hldgs faces challenges in effectively managing its debt levels, indicating potential financial strain.
To track all earnings releases for Vertiv Hldgs visit their earnings calendar on our site.
This article was generated by Benzinga’s automated content engine and reviewed by an editor.
© 2024 Benzinga.com. Benzinga does not provide investment advice. All rights reserved.
