Enova International ENVA is set to give its latest quarterly earnings report on Tuesday, 2025-04-29. Here’s what investors need to know before the announcement.
Analysts estimate that Enova International will report an earnings per share (EPS) of $2.40.
Enova International bulls will hope to hear the company announce they’ve not only beaten that estimate, but also to provide positive guidance, or forecasted growth, for the next quarter.
New investors should note that it is sometimes not an earnings beat or miss that most affects the price of a stock, but the guidance (or forecast).
Historical Earnings Performance
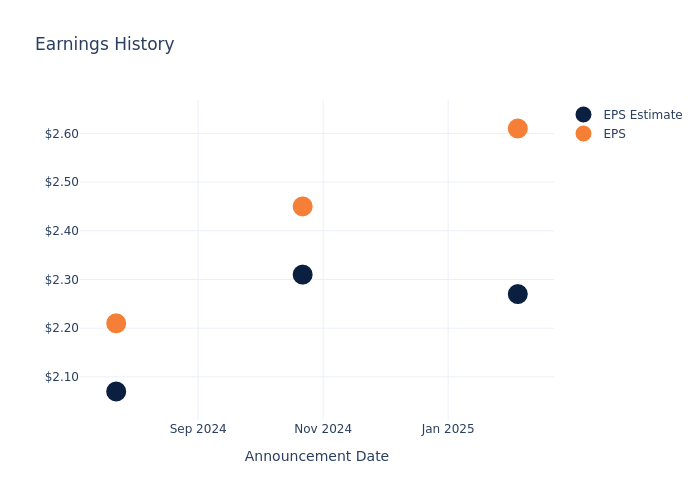
In the previous earnings release, the company beat EPS by $0.34, leading to a 1.59% increase in the share price the following trading session.
Here’s a look at Enova International’s past performance and the resulting price change:
| Quarter | Q4 2024 | Q3 2024 | Q2 2024 | Q1 2024 |
|---|---|---|---|---|
| EPS Estimate | 2.27 | 2.31 | 2.07 | 1.72 |
| EPS Actual | 2.61 | 2.45 | 2.21 | 1.91 |
| Price Change % | 2.0% | -2.0% | 4.0% | -1.0% |
Market Performance of Enova International’s Stock
Shares of Enova International were trading at $97.88 as of April 25. Over the last 52-week period, shares are up 62.36%. Given that these returns are generally positive, long-term shareholders are likely bullish going into this earnings release.
Analyst Insights on Enova International
Understanding market sentiments and expectations within the industry is crucial for investors. This analysis delves into the latest insights on Enova International.
The consensus rating for Enova International is Buy, based on 4 analyst ratings. With an average one-year price target of $134.5, there’s a potential 37.41% upside.
Comparing Ratings Among Industry Peers
The following analysis focuses on the analyst ratings and average 1-year price targets of and Enova International, three prominent industry players, providing insights into their relative performance expectations and market positioning.
Peers Comparative Analysis Summary
The peer analysis summary provides a snapshot of key metrics for and Enova International, illuminating their respective standings within the industry. These metrics offer valuable insights into their market positions and comparative performance.
| Company | Consensus | Revenue Growth | Gross Profit | Return on Equity |
|---|---|---|---|---|
| Enova International | Buy | 25.01% | $336.05M | 5.36% |
Key Takeaway:
Enova International ranks at the bottom for Revenue Growth among its peers. It is also at the bottom for Gross Profit. However, it is in the middle for Return on Equity.
All You Need to Know About Enova International
Enova International Inc provides online financial services, including short-term consumer loans, line of credit accounts, and installment loans to customers mainly in the United States and and Brazil. Consumers apply for credit online, the company’s technology platforms process the applications, and transactions are completed quickly and efficiently. Its customers are predominantly retail consumers and small businesses. Enova markets its financing products under the names CashNetUSA, NetCredit, OnDeck, Headway Capital, and Simplic. The company also operates a money transfer platform under the name Pangea. Geographically, the company generates a majority of its revenue from its business in the United States and the rest from other international countries.
Enova International: A Financial Overview
Market Capitalization Analysis: Falling below industry benchmarks, the company’s market capitalization reflects a reduced size compared to peers. This positioning may be influenced by factors such as growth expectations or operational capacity.
Revenue Growth: Over the 3 months period, Enova International showcased positive performance, achieving a revenue growth rate of 25.01% as of 31 December, 2024. This reflects a substantial increase in the company’s top-line earnings. As compared to its peers, the company achieved a growth rate higher than the average among peers in Financials sector.
Net Margin: Enova International’s net margin is below industry averages, indicating potential challenges in maintaining strong profitability. With a net margin of 8.73%, the company may face hurdles in effective cost management.
Return on Equity (ROE): Enova International’s ROE stands out, surpassing industry averages. With an impressive ROE of 5.36%, the company demonstrates effective use of equity capital and strong financial performance.
Return on Assets (ROA): Enova International’s ROA stands out, surpassing industry averages. With an impressive ROA of 1.24%, the company demonstrates effective utilization of assets and strong financial performance.
Debt Management: With a high debt-to-equity ratio of 3.0, Enova International faces challenges in effectively managing its debt levels, indicating potential financial strain.
To track all earnings releases for Enova International visit their earnings calendar on our site.
This article was generated by Benzinga’s automated content engine and reviewed by an editor.
© 2025 Benzinga.com. Benzinga does not provide investment advice. All rights reserved.