PPG Indus PPG will release its quarterly earnings report on Tuesday, 2025-04-29. Here’s a brief overview for investors ahead of the announcement.
Analysts anticipate PPG Indus to report an earnings per share (EPS) of $1.64.
The market awaits PPG Indus’s announcement, with hopes high for news of surpassing estimates and providing upbeat guidance for the next quarter.
It’s important for new investors to understand that guidance can be a significant driver of stock prices.
Performance in Previous Earnings
During the last quarter, the company reported an EPS missed by $0.04, leading to a 6.0% drop in the share price on the subsequent day.
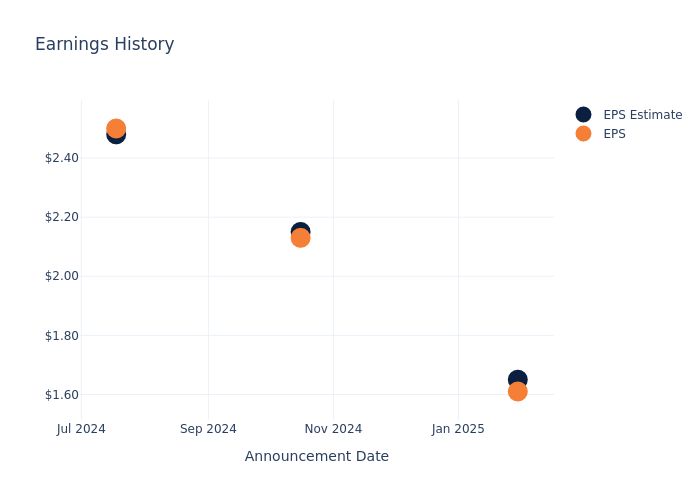
Here’s a look at PPG Indus’s past performance and the resulting price change:
| Quarter | Q4 2024 | Q3 2024 | Q2 2024 | Q1 2024 |
|---|---|---|---|---|
| EPS Estimate | 1.65 | 2.15 | 2.48 | 1.86 |
| EPS Actual | 1.61 | 2.13 | 2.50 | 1.86 |
| Price Change % | -6.0% | 1.0% | -3.0% | -3.0% |
PPG Indus Share Price Analysis
Shares of PPG Indus were trading at $102.57 as of April 25. Over the last 52-week period, shares are down 20.0%. Given that these returns are generally negative, long-term shareholders are likely upset going into this earnings release.
Insights Shared by Analysts on PPG Indus
For investors, staying informed about market sentiments and expectations in the industry is paramount. This analysis provides an exploration of the latest insights on PPG Indus.
Analysts have provided PPG Indus with 11 ratings, resulting in a consensus rating of Neutral. The average one-year price target stands at $125.45, suggesting a potential 22.31% upside.
Understanding Analyst Ratings Among Peers
The analysis below examines the analyst ratings and average 1-year price targets of Intl Flavors & Fragrances, DuPont de Nemours and RPM Intl, three significant industry players, providing valuable insights into their relative performance expectations and market positioning.
- Analysts currently favor an Outperform trajectory for Intl Flavors & Fragrances, with an average 1-year price target of $95.14, suggesting a potential 7.24% downside.
- Analysts currently favor an Outperform trajectory for DuPont de Nemours, with an average 1-year price target of $87.38, suggesting a potential 14.81% downside.
- Analysts currently favor an Neutral trajectory for RPM Intl, with an average 1-year price target of $114.43, suggesting a potential 11.56% upside.
Peer Metrics Summary
Within the peer analysis summary, vital metrics for Intl Flavors & Fragrances, DuPont de Nemours and RPM Intl are presented, shedding light on their respective standings within the industry and offering valuable insights into their market positions and comparative performance.
| Company | Consensus | Revenue Growth | Gross Profit | Return on Equity |
|---|---|---|---|---|
| PPG Indus | Neutral | -7.72% | $755M | -3.84% |
| Intl Flavors & Fragrances | Outperform | 2.52% | $980M | -0.32% |
| DuPont de Nemours | Outperform | 6.69% | $1.12B | -0.50% |
| RPM Intl | Neutral | -3.05% | $567.49M | 1.92% |
Key Takeaway:
PPG Indus is at the bottom for Revenue Growth with -7.72%. It is at the bottom for Gross Profit with $755M. It is at the bottom for Return on Equity with -3.84%.
Unveiling the Story Behind PPG Indus
PPG is a global producer of coatings. The company is the world’s largest producer of coatings after the purchase of selected Akzo Nobel assets. PPG’s products are sold to a wide variety of end users, including the automotive, aerospace, construction, and industrial markets. The company has a footprint in many regions around the globe, with less than half of sales coming from North America in recent years. PPG is focused on its coatings and specialty products and expansion into emerging regions, as exemplified by the Comex acquisition.
PPG Indus’s Financial Performance
Market Capitalization: Surpassing industry standards, the company’s market capitalization asserts its dominance in terms of size, suggesting a robust market position.
Negative Revenue Trend: Examining PPG Indus’s financials over 3 months reveals challenges. As of 31 December, 2024, the company experienced a decline of approximately -7.72% in revenue growth, reflecting a decrease in top-line earnings. As compared to competitors, the company encountered difficulties, with a growth rate lower than the average among peers in the Materials sector.
Net Margin: PPG Indus’s net margin falls below industry averages, indicating challenges in achieving strong profitability. With a net margin of -12.93%, the company may face hurdles in effective cost management.
Return on Equity (ROE): PPG Indus’s ROE lags behind industry averages, suggesting challenges in maximizing returns on equity capital. With an ROE of -3.84%, the company may face hurdles in achieving optimal financial performance.
Return on Assets (ROA): The company’s ROA is below industry benchmarks, signaling potential difficulties in efficiently utilizing assets. With an ROA of -1.36%, the company may need to address challenges in generating satisfactory returns from its assets.
Debt Management: PPG Indus’s debt-to-equity ratio is below the industry average at 0.94, reflecting a lower dependency on debt financing and a more conservative financial approach.
To track all earnings releases for PPG Indus visit their earnings calendar on our site.
This article was generated by Benzinga’s automated content engine and reviewed by an editor.
© 2025 Benzinga.com. Benzinga does not provide investment advice. All rights reserved.