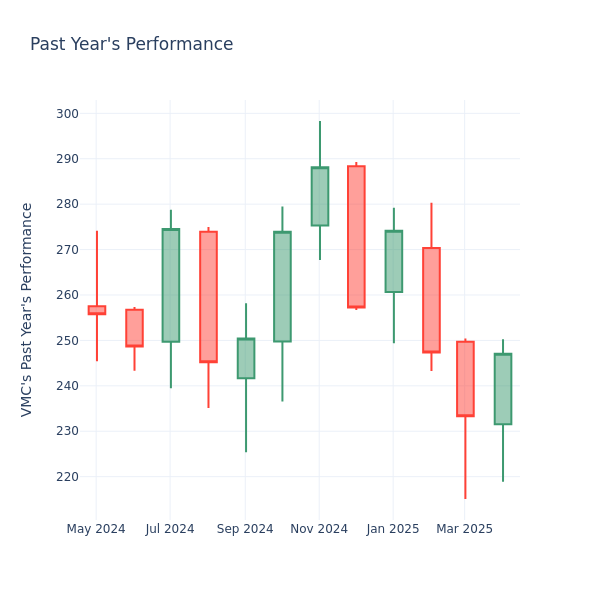
In the current market session, Vulcan Materials Inc. VMC share price is at $247.04, after a 0.99% drop. Over the past month, the stock increased by 6.05%, but over the past year, it actually fell by 5.51%. With good short-term performance like this, and questionable long-term performance, long-term shareholders might want to start looking into the company’s price-to-earnings ratio.
How Does Vulcan Materials P/E Compare to Other Companies?
The P/E ratio measures the current share price to the company’s EPS. It is used by long-term investors to analyze the company’s current performance against it’s past earnings, historical data and aggregate market data for the industry or the indices, such as S&P 500. A higher P/E indicates that investors expect the company to perform better in the future, and the stock is probably overvalued, but not necessarily. It also could indicate that investors are willing to pay a higher share price currently, because they expect the company to perform better in the upcoming quarters. This leads investors to also remain optimistic about rising dividends in the future.
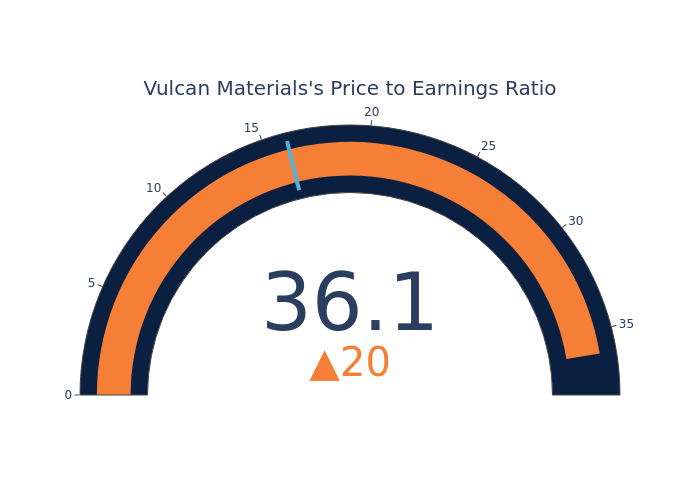
Compared to the aggregate P/E ratio of 16.13 in the Construction Materials industry, Vulcan Materials Inc. has a higher P/E ratio of 36.11. Shareholders might be inclined to think that Vulcan Materials Inc. might perform better than its industry group. It’s also possible that the stock is overvalued.
In conclusion, the price-to-earnings ratio is a useful metric for analyzing a company’s market performance, but it has its limitations. While a lower P/E can indicate that a company is undervalued, it can also suggest that shareholders do not expect future growth. Additionally, the P/E ratio should not be used in isolation, as other factors such as industry trends and business cycles can also impact a company’s stock price. Therefore, investors should use the P/E ratio in conjunction with other financial metrics and qualitative analysis to make informed investment decisions.
Market News and Data brought to you by Benzinga APIs
© 2025 Benzinga.com. Benzinga does not provide investment advice. All rights reserved.