UFP Industries UFPI is gearing up to announce its quarterly earnings on Monday, 2025-04-28. Here’s a quick overview of what investors should know before the release.
Analysts are estimating that UFP Industries will report an earnings per share (EPS) of $1.57.
The market awaits UFP Industries’s announcement, with hopes high for news of surpassing estimates and providing upbeat guidance for the next quarter.
It’s important for new investors to understand that guidance can be a significant driver of stock prices.
Earnings Track Record
During the last quarter, the company reported an EPS missed by $0.04, leading to a 0.0% drop in the share price on the subsequent day.
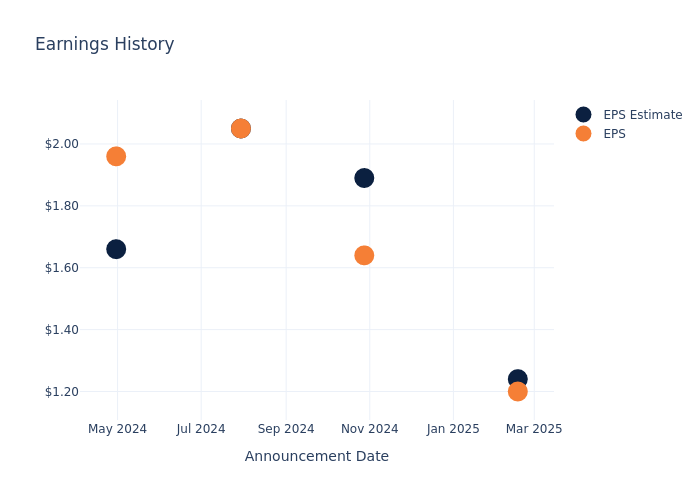
Here’s a look at UFP Industries’s past performance and the resulting price change:
| Quarter | Q4 2024 | Q3 2024 | Q2 2024 | Q1 2024 |
|---|---|---|---|---|
| EPS Estimate | 1.24 | 1.89 | 2.05 | 1.66 |
| EPS Actual | 1.20 | 1.64 | 2.05 | 1.96 |
| Price Change % | -2.0% | -6.0% | -3.0% | 0.0% |
Tracking UFP Industries’s Stock Performance
Shares of UFP Industries were trading at $107.97 as of April 24. Over the last 52-week period, shares are down 8.11%. Given that these returns are generally negative, long-term shareholders are likely bearish going into this earnings release.
Analysts’ Take on UFP Industries
For investors, grasping market sentiments and expectations in the industry is vital. This analysis explores the latest insights regarding UFP Industries.
Analysts have given UFP Industries a total of 1 ratings, with the consensus rating being Buy. The average one-year price target is $135.0, indicating a potential 25.03% upside.
Comparing Ratings with Competitors
This comparison focuses on the analyst ratings and average 1-year price targets of Simpson Manufacturing Co, Trex Co and Fortune Brands, three major players in the industry, shedding light on their relative performance expectations and market positioning.
- Analysts currently favor an Neutral trajectory for Simpson Manufacturing Co, with an average 1-year price target of $188.5, suggesting a potential 74.59% upside.
- Analysts currently favor an Neutral trajectory for Trex Co, with an average 1-year price target of $73.58, suggesting a potential 31.85% downside.
- Analysts currently favor an Neutral trajectory for Fortune Brands, with an average 1-year price target of $75.4, suggesting a potential 30.17% downside.
Snapshot: Peer Analysis
The peer analysis summary offers a detailed examination of key metrics for Simpson Manufacturing Co, Trex Co and Fortune Brands, providing valuable insights into their respective standings within the industry and their market positions and comparative performance.
| Company | Consensus | Revenue Growth | Gross Profit | Return on Equity |
|---|---|---|---|---|
| UFP Industries | Buy | -4.09% | $239.51M | 2.05% |
| Simpson Manufacturing Co | Neutral | 3.13% | $227.69M | 3.02% |
| Trex Co | Neutral | -14.36% | $54.74M | 1.12% |
| Fortune Brands | Neutral | -4.92% | $507.90M | 4.36% |
Key Takeaway:
UFP Industries ranks at the bottom for Revenue Growth among its peers. It is also at the bottom for Gross Profit. However, it is in the middle for Return on Equity.
Discovering UFP Industries: A Closer Look
UFP Industries Inc is a supplier of lumber to the manufactured housing industry. Today UFP Industries is a multibillion-dollar holding company with subsidiaries around the globe that serve three markets: retail, packaging and construction. Its business segments consist of UFP Retail Solutions, UFP Packaging, UFP Construction, All other and Corporate.
UFP Industries’s Economic Impact: An Analysis
Market Capitalization Perspectives: The company’s market capitalization falls below industry averages, signaling a relatively smaller size compared to peers. This positioning may be influenced by factors such as perceived growth potential or operational scale.
Revenue Challenges: UFP Industries’s revenue growth over 3 months faced difficulties. As of 31 December, 2024, the company experienced a decline of approximately -4.09%. This indicates a decrease in top-line earnings. As compared to competitors, the company encountered difficulties, with a growth rate lower than the average among peers in the Industrials sector.
Net Margin: UFP Industries’s net margin is below industry averages, indicating potential challenges in maintaining strong profitability. With a net margin of 4.48%, the company may face hurdles in effective cost management.
Return on Equity (ROE): The company’s ROE is below industry benchmarks, signaling potential difficulties in efficiently using equity capital. With an ROE of 2.05%, the company may need to address challenges in generating satisfactory returns for shareholders.
Return on Assets (ROA): UFP Industries’s ROA is below industry averages, indicating potential challenges in efficiently utilizing assets. With an ROA of 1.56%, the company may face hurdles in achieving optimal financial returns.
Debt Management: UFP Industries’s debt-to-equity ratio is below the industry average. With a ratio of 0.11, the company relies less on debt financing, maintaining a healthier balance between debt and equity, which can be viewed positively by investors.
To track all earnings releases for UFP Industries visit their earnings calendar on our site.
This article was generated by Benzinga’s automated content engine and reviewed by an editor.
© 2025 Benzinga.com. Benzinga does not provide investment advice. All rights reserved.