Aon AON is preparing to release its quarterly earnings on Friday, 2025-04-25. Here’s a brief overview of what investors should keep in mind before the announcement.
Analysts expect Aon to report an earnings per share (EPS) of $6.03.
Aon bulls will hope to hear the company announce they’ve not only beaten that estimate, but also to provide positive guidance, or forecasted growth, for the next quarter.
New investors should note that it is sometimes not an earnings beat or miss that most affects the price of a stock, but the guidance (or forecast).
Overview of Past Earnings
Last quarter the company beat EPS by $0.17, which was followed by a 0.0% drop in the share price the next day.
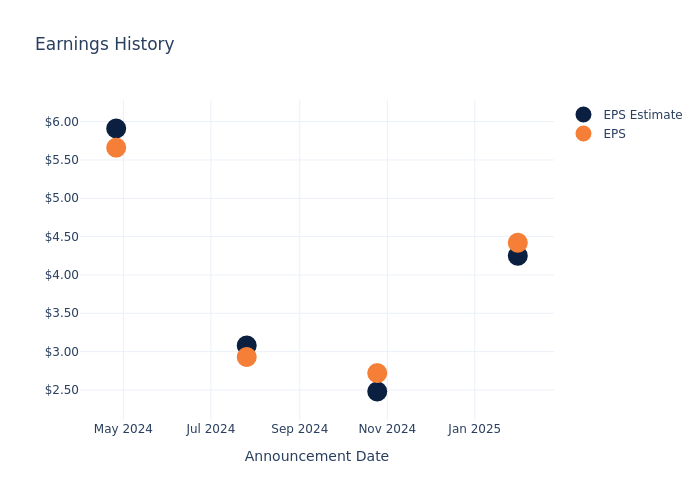
Here’s a look at Aon’s past performance and the resulting price change:
| Quarter | Q4 2024 | Q3 2024 | Q2 2024 | Q1 2024 |
|---|---|---|---|---|
| EPS Estimate | 4.25 | 2.48 | 3.08 | 5.91 |
| EPS Actual | 4.42 | 2.72 | 2.93 | 5.66 |
| Price Change % | -1.0% | 5.0% | 8.0% | -7.000000000000001% |
Stock Performance
Shares of Aon were trading at $368.83 as of April 23. Over the last 52-week period, shares are up 28.32%. Given that these returns are generally positive, long-term shareholders are likely bullish going into this earnings release.
Analyst Observations about Aon
For investors, grasping market sentiments and expectations in the industry is vital. This analysis explores the latest insights regarding Aon.
The consensus rating for Aon is Outperform, based on 7 analyst ratings. With an average one-year price target of $414.0, there’s a potential 12.25% upside.
Understanding Analyst Ratings Among Peers
In this analysis, we delve into the analyst ratings and average 1-year price targets of Arthur J. Gallagher, Marsh & McLennan Cos and Brown & Brown, three key industry players, offering insights into their relative performance expectations and market positioning.
- Analysts currently favor an Neutral trajectory for Arthur J. Gallagher, with an average 1-year price target of $324.1, suggesting a potential 12.13% downside.
- Analysts currently favor an Neutral trajectory for Marsh & McLennan Cos, with an average 1-year price target of $233.78, suggesting a potential 36.62% downside.
- Analysts currently favor an Neutral trajectory for Brown & Brown, with an average 1-year price target of $120.0, suggesting a potential 67.46% downside.
Overview of Peer Analysis
The peer analysis summary presents essential metrics for Arthur J. Gallagher, Marsh & McLennan Cos and Brown & Brown, unveiling their respective standings within the industry and providing valuable insights into their market positions and comparative performance.
| Company | Consensus | Revenue Growth | Gross Profit | Return on Equity |
|---|---|---|---|---|
| Aon | Outperform | 22.87% | $2.03B | 11.58% |
| Arthur J. Gallagher | Neutral | 11.68% | $1.13B | 1.60% |
| Marsh & McLennan Cos | Neutral | 9.08% | $3.21B | 10.08% |
| Brown & Brown | Neutral | 12.04% | $506M | 3.21% |
Key Takeaway:
Aon ranks at the top for Revenue Growth and Gross Profit among its peers. It is in the middle for Return on Equity.
Discovering Aon: A Closer Look
Aon is a leading global provider of insurance and reinsurance brokerage and human resources solutions. Its operations are tilted toward its brokerage operations. Headquartered in London, Aon has about 50,000 employees and operations in over 120 countries.
Financial Insights: Aon
Market Capitalization Analysis: With a profound presence, the company’s market capitalization is above industry averages. This reflects substantial size and strong market recognition.
Positive Revenue Trend: Examining Aon’s financials over 3 months reveals a positive narrative. The company achieved a noteworthy revenue growth rate of 22.87% as of 31 December, 2024, showcasing a substantial increase in top-line earnings. As compared to its peers, the revenue growth lags behind its industry peers. The company achieved a growth rate lower than the average among peers in Financials sector.
Net Margin: The company’s net margin is a standout performer, exceeding industry averages. With an impressive net margin of 17.27%, the company showcases strong profitability and effective cost control.
Return on Equity (ROE): Aon’s ROE stands out, surpassing industry averages. With an impressive ROE of 11.58%, the company demonstrates effective use of equity capital and strong financial performance.
Return on Assets (ROA): Aon’s ROA excels beyond industry benchmarks, reaching 1.45%. This signifies efficient management of assets and strong financial health.
Debt Management: The company faces challenges in debt management with a debt-to-equity ratio higher than the industry average. With a ratio of 2.92, caution is advised due to increased financial risk.
To track all earnings releases for Aon visit their earnings calendar on our site.
This article was generated by Benzinga’s automated content engine and reviewed by an editor.
Market News and Data brought to you by Benzinga APIs
© 2025 Benzinga.com. Benzinga does not provide investment advice. All rights reserved.