Vertiv Hldgs VRT is gearing up to announce its quarterly earnings on Wednesday, 2025-04-23. Here’s a quick overview of what investors should know before the release.
Analysts are estimating that Vertiv Hldgs will report an earnings per share (EPS) of $0.62.
Anticipation surrounds Vertiv Hldgs’s announcement, with investors hoping to hear about both surpassing estimates and receiving positive guidance for the next quarter.
New investors should understand that while earnings performance is important, market reactions are often driven by guidance.
Overview of Past Earnings
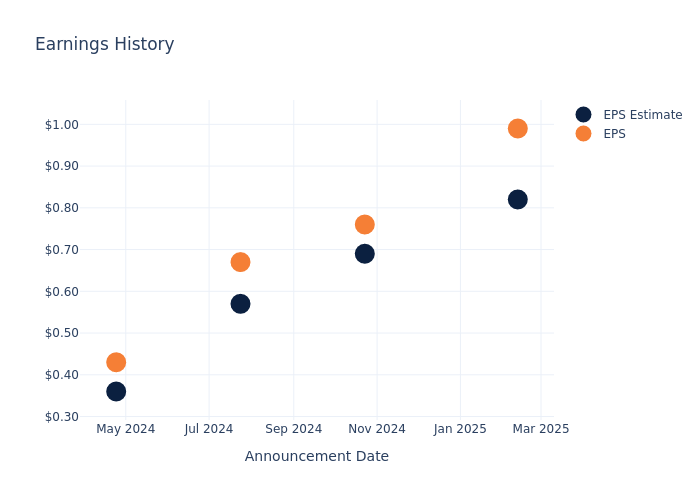
During the last quarter, the company reported an EPS beat by $0.17, leading to a 1.76% drop in the share price on the subsequent day.
Here’s a look at Vertiv Hldgs’s past performance and the resulting price change:
| Quarter | Q4 2024 | Q3 2024 | Q2 2024 | Q1 2024 |
|---|---|---|---|---|
| EPS Estimate | 0.82 | 0.69 | 0.57 | 0.36 |
| EPS Actual | 0.99 | 0.76 | 0.67 | 0.43 |
| Price Change % | -2.0% | 2.0% | -3.0% | 7.000000000000001% |

Market Performance of Vertiv Hldgs’s Stock
Shares of Vertiv Hldgs were trading at $67.57 as of April 21. Over the last 52-week period, shares are down 16.87%. Given that these returns are generally negative, long-term shareholders are likely unhappy going into this earnings release.
Analyst Views on Vertiv Hldgs
For investors, grasping market sentiments and expectations in the industry is vital. This analysis explores the latest insights regarding Vertiv Hldgs.
Analysts have given Vertiv Hldgs a total of 9 ratings, with the consensus rating being Neutral. The average one-year price target is $106.78, indicating a potential 58.03% upside.
Peer Ratings Comparison
The following analysis focuses on the analyst ratings and average 1-year price targets of Rockwell Automation, AMETEK and Hubbell, three prominent industry players, providing insights into their relative performance expectations and market positioning.
- Analysts currently favor an Neutral trajectory for Rockwell Automation, with an average 1-year price target of $294.36, suggesting a potential 335.64% upside.
- Analysts currently favor an Neutral trajectory for AMETEK, with an average 1-year price target of $187.67, suggesting a potential 177.74% upside.
- Analysts currently favor an Neutral trajectory for Hubbell, with an average 1-year price target of $391.33, suggesting a potential 479.15% upside.
Summary of Peers Analysis
The peer analysis summary presents essential metrics for Rockwell Automation, AMETEK and Hubbell, unveiling their respective standings within the industry and providing valuable insights into their market positions and comparative performance.
| Company | Consensus | Revenue Growth | Gross Profit | Return on Equity |
|---|---|---|---|---|
| Vertiv Holdings | Neutral | 25.79% | $870.20M | 6.92% |
| Rockwell Automation | Neutral | -8.33% | $722M | 5.32% |
| AMETEK | Neutral | 1.77% | $644.75M | 4.03% |
| Hubbell | Neutral | -0.85% | $450.60M | 6.06% |
Key Takeaway:
Vertiv Holdings ranks first in revenue growth among its peers. It ranks second in gross profit and return on equity.
Get to Know Vertiv Hldgs Better
Vertiv has roots tracing back to 1946 when its founder, Ralph Liebert, developed an air-cooling system for mainframe data rooms. As computers started making their way into commercial applications in 1965, Liebert developed one of the first computer room air conditioning, or CRAC, units, enabling the precise control of temperature and humidity. The firm has slowly expanded its data center portfolio through internal product development and the acquisition of thermal and power management products like condensers, busways, and switches. Vertiv has global operations today; its products can be found in data centers in most regions throughout the world.
Vertiv Hldgs’s Financial Performance
Market Capitalization Analysis: With an elevated market capitalization, the company stands out above industry averages, showcasing substantial size and market acknowledgment.
Revenue Growth: Vertiv Hldgs displayed positive results in 3 months. As of 31 December, 2024, the company achieved a solid revenue growth rate of approximately 25.79%. This indicates a notable increase in the company’s top-line earnings. As compared to competitors, the company surpassed expectations with a growth rate higher than the average among peers in the Industrials sector.
Net Margin: Vertiv Hldgs’s net margin excels beyond industry benchmarks, reaching 6.26%. This signifies efficient cost management and strong financial health.
Return on Equity (ROE): Vertiv Hldgs’s financial strength is reflected in its exceptional ROE, which exceeds industry averages. With a remarkable ROE of 6.92%, the company showcases efficient use of equity capital and strong financial health.
Return on Assets (ROA): Vertiv Hldgs’s financial strength is reflected in its exceptional ROA, which exceeds industry averages. With a remarkable ROA of 1.63%, the company showcases efficient use of assets and strong financial health.
Debt Management: Vertiv Hldgs’s debt-to-equity ratio surpasses industry norms, standing at 1.29. This suggests the company carries a substantial amount of debt, posing potential financial challenges.
To track all earnings releases for Vertiv Hldgs visit their earnings calendar on our site.
This article was generated by Benzinga’s automated content engine and reviewed by an editor.
© 2025 Benzinga.com. Benzinga does not provide investment advice. All rights reserved.
