DALLAS, April 22, 2025 (GLOBE NEWSWIRE) — Texas new home sales slipped in three of its four largest markets last month and took longer to sell, according to the newest monthly Texas New Home Sales Report released today by HomesUSA.com and its founder and CEO, Ben Caballero, the nation’s top-ranked real estate agent.
The HomesUSA.com New Home Sales Report uses Multiple Listing Service data – the most comprehensive, current, and accurate information – from the Realtor Associations of North Texas, Houston, Austin, and San Antonio. All averages in the monthly report are based on three-month rolling averages to reduce short-term volatility and anomalies.
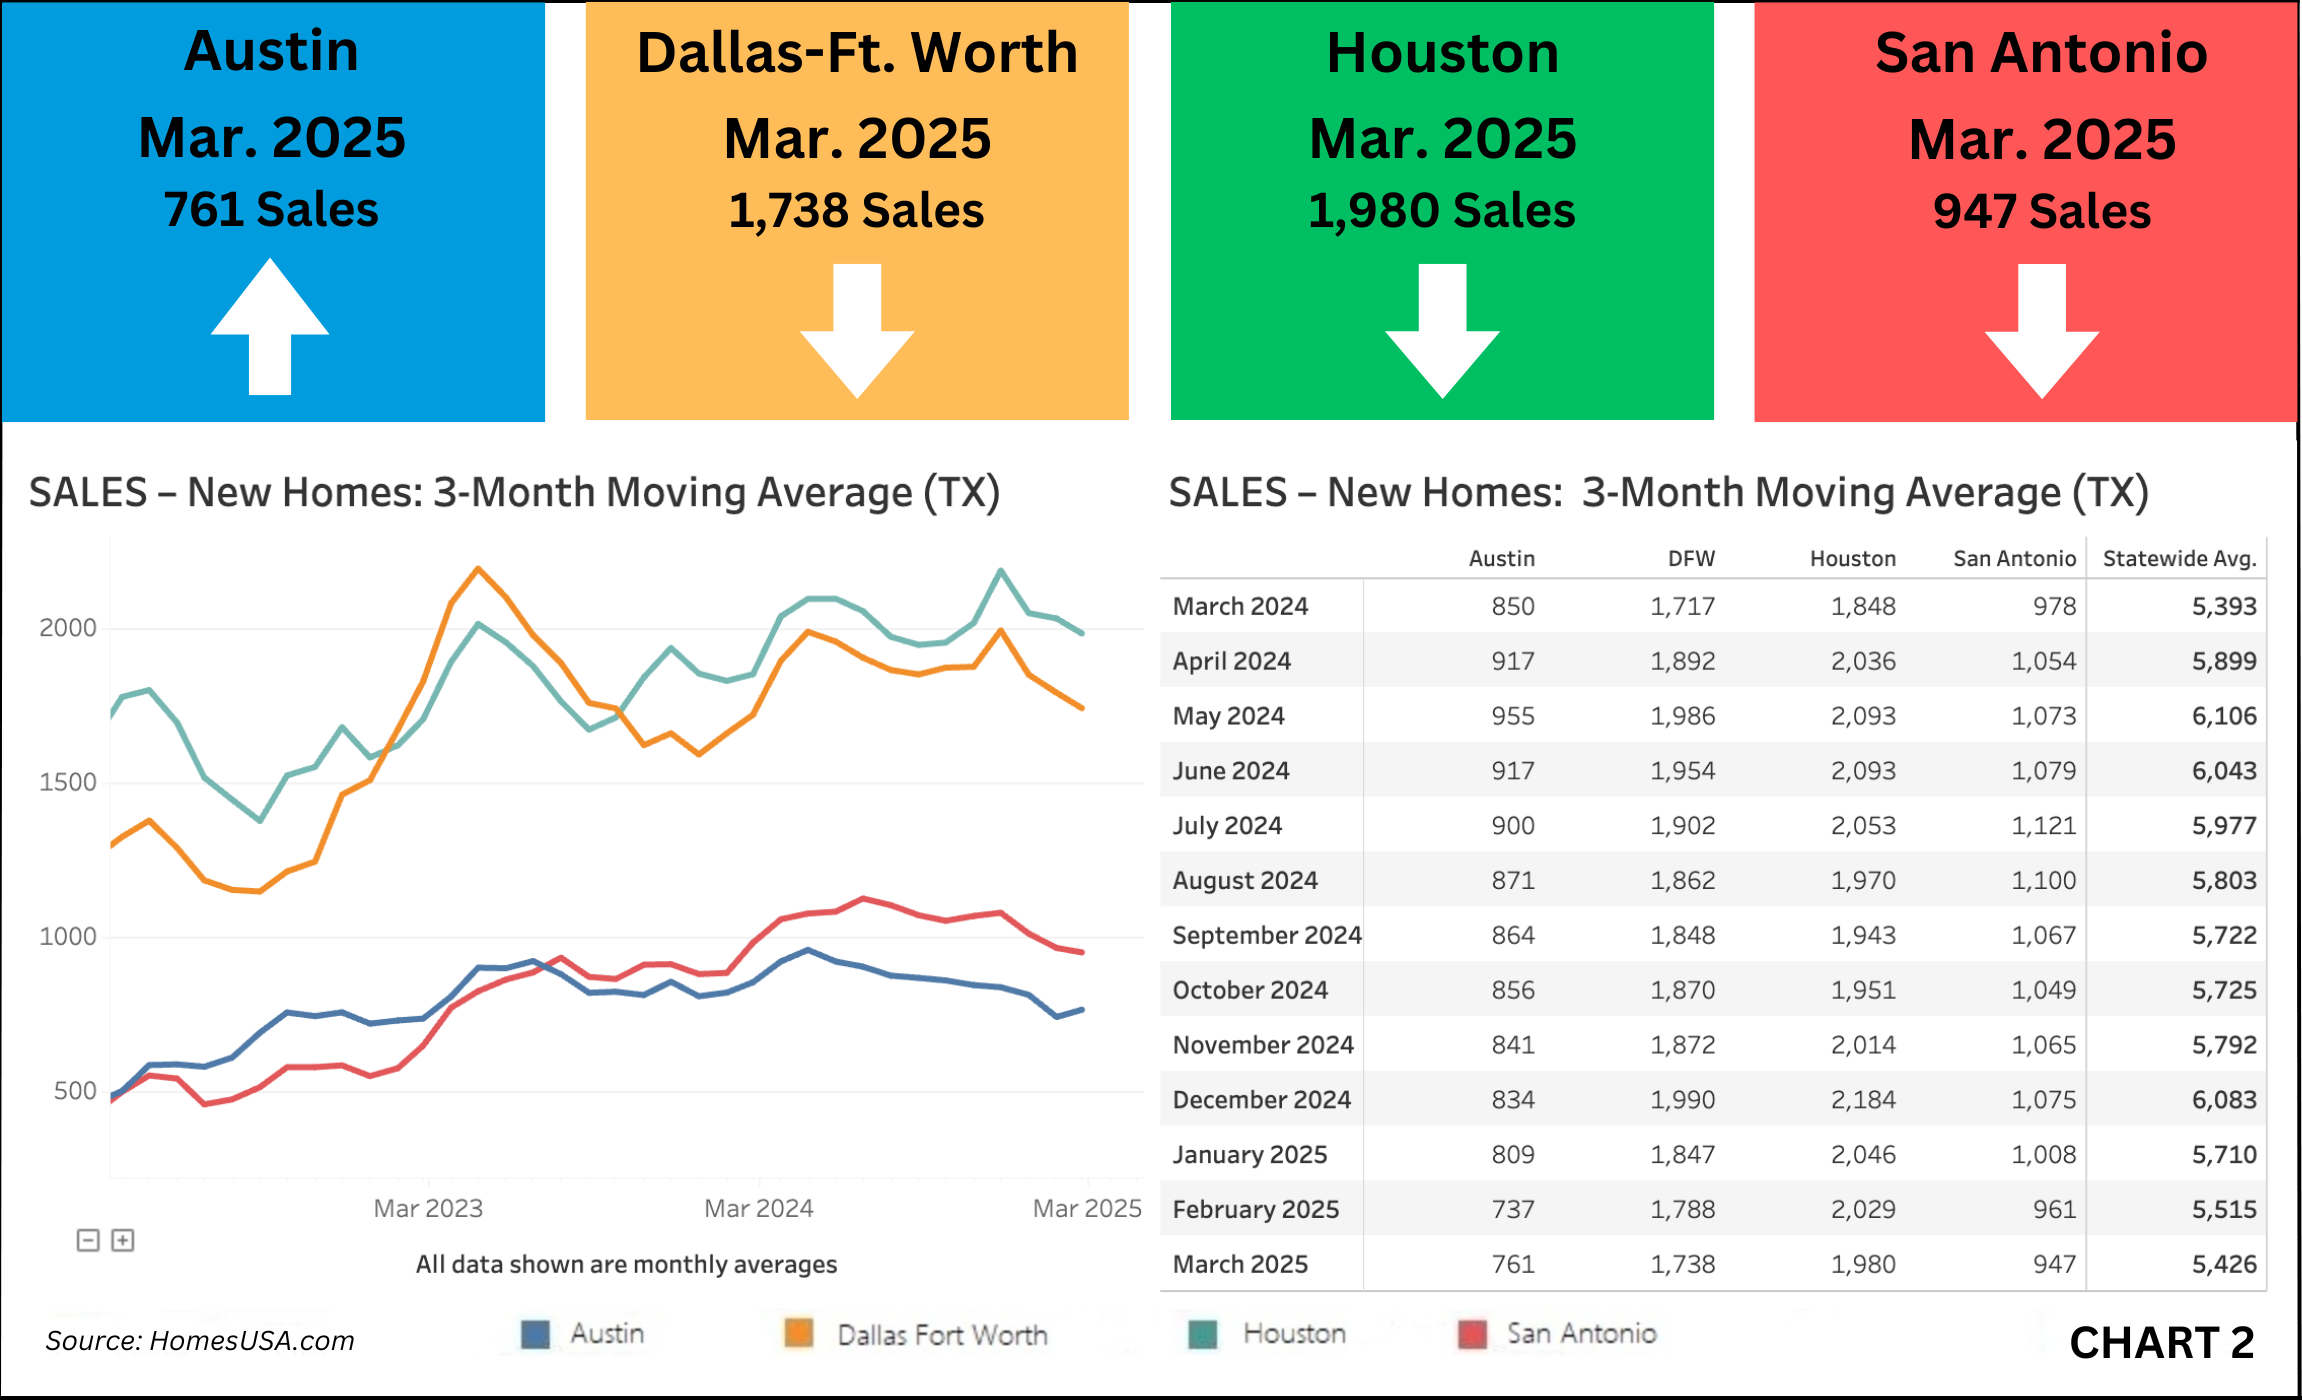
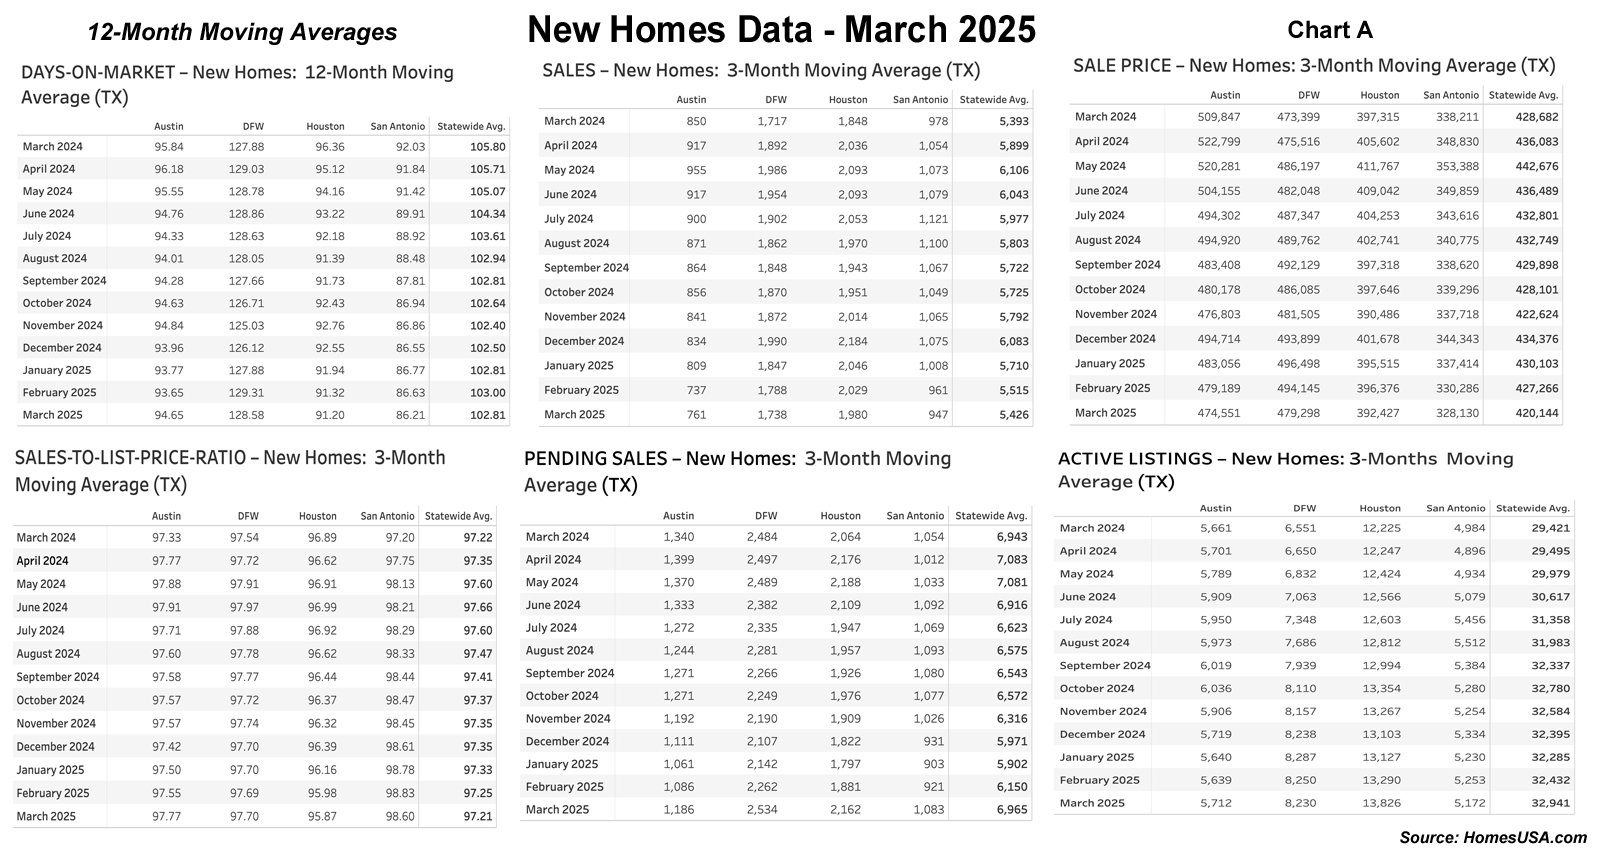
In March, Texas’ new home sales were lower in Houston, Dallas-Ft. Worth, and San Antonio markets. Austin saw a small increase in new home sales to 761 last month, up from 737 in February – a one-month increase of just over 3 percent. The combined average of these four Texas markets fell to 5,426 total new home sales in March versus 5,515 new home sales in February.
![]()
“Texas new home sales continued to show signs of strain in March, despite some improvement in interest rates,” said Ben Caballero, founder and CEO of HomesUSA.com.
“We’re in what should be the heart of the home buying season, but sales momentum has not met seasonal expectations,” Caballero added. “On a brighter note, pending sales are rising, and giving reason to expect a sales bounce.”
According to HomesUSA.com’s proprietary Texas New Home Sales Index, Days on Market – which measures how fast new homes sell – increased last month in all four top markets: Houston, Dallas-Ft. Worth, San Antonio, and Austin, averaging 111.52 days, up from 108.75 days in February.
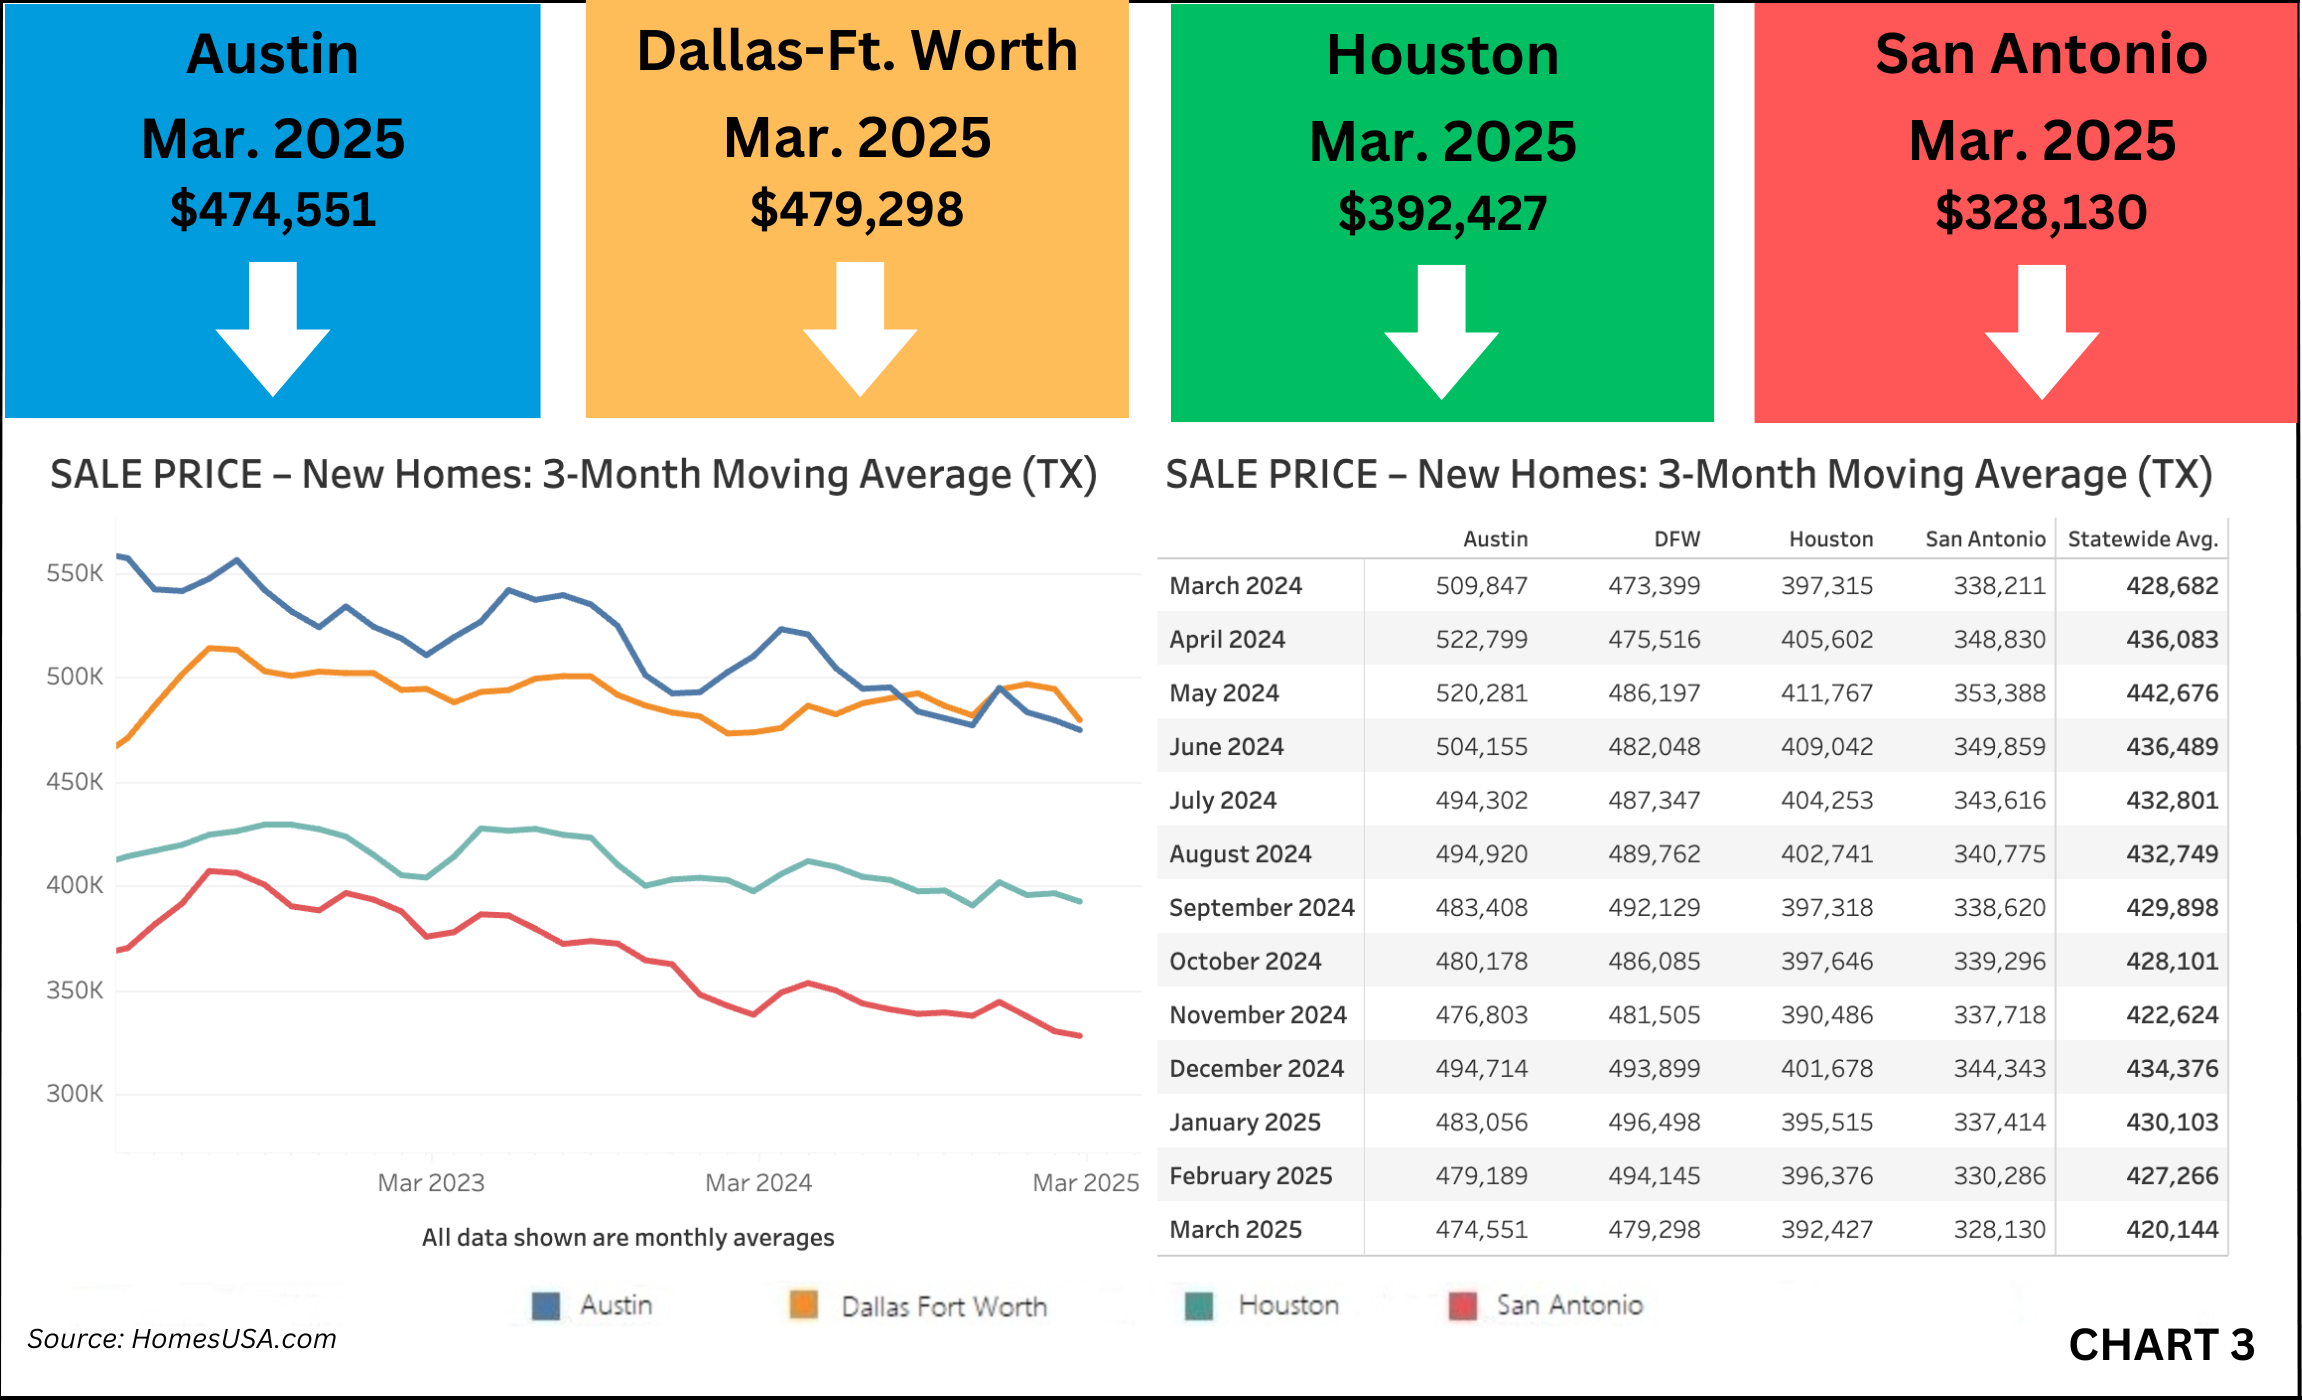
Last month, the average new home prices in Houston, Dallas-Ft. Worth, San Antonio, and Austin were all lower month-over-month, declining to an overall average of $420,144 in March versus $427,266 in February.
The average new home price dropped the most in Dallas-Ft. Worth by nearly $15,000 in March versus February. Average prices were more than $4,600 lower in Austin, nearly $4,000 in Houston, and over $2,100 in San Antonio. Despite the steep drop, Dallas-Ft. Worth remains the state’s most expensive new home market, with an average price of $479,298 versus Austin, the second most expensive average last month at $474,551.
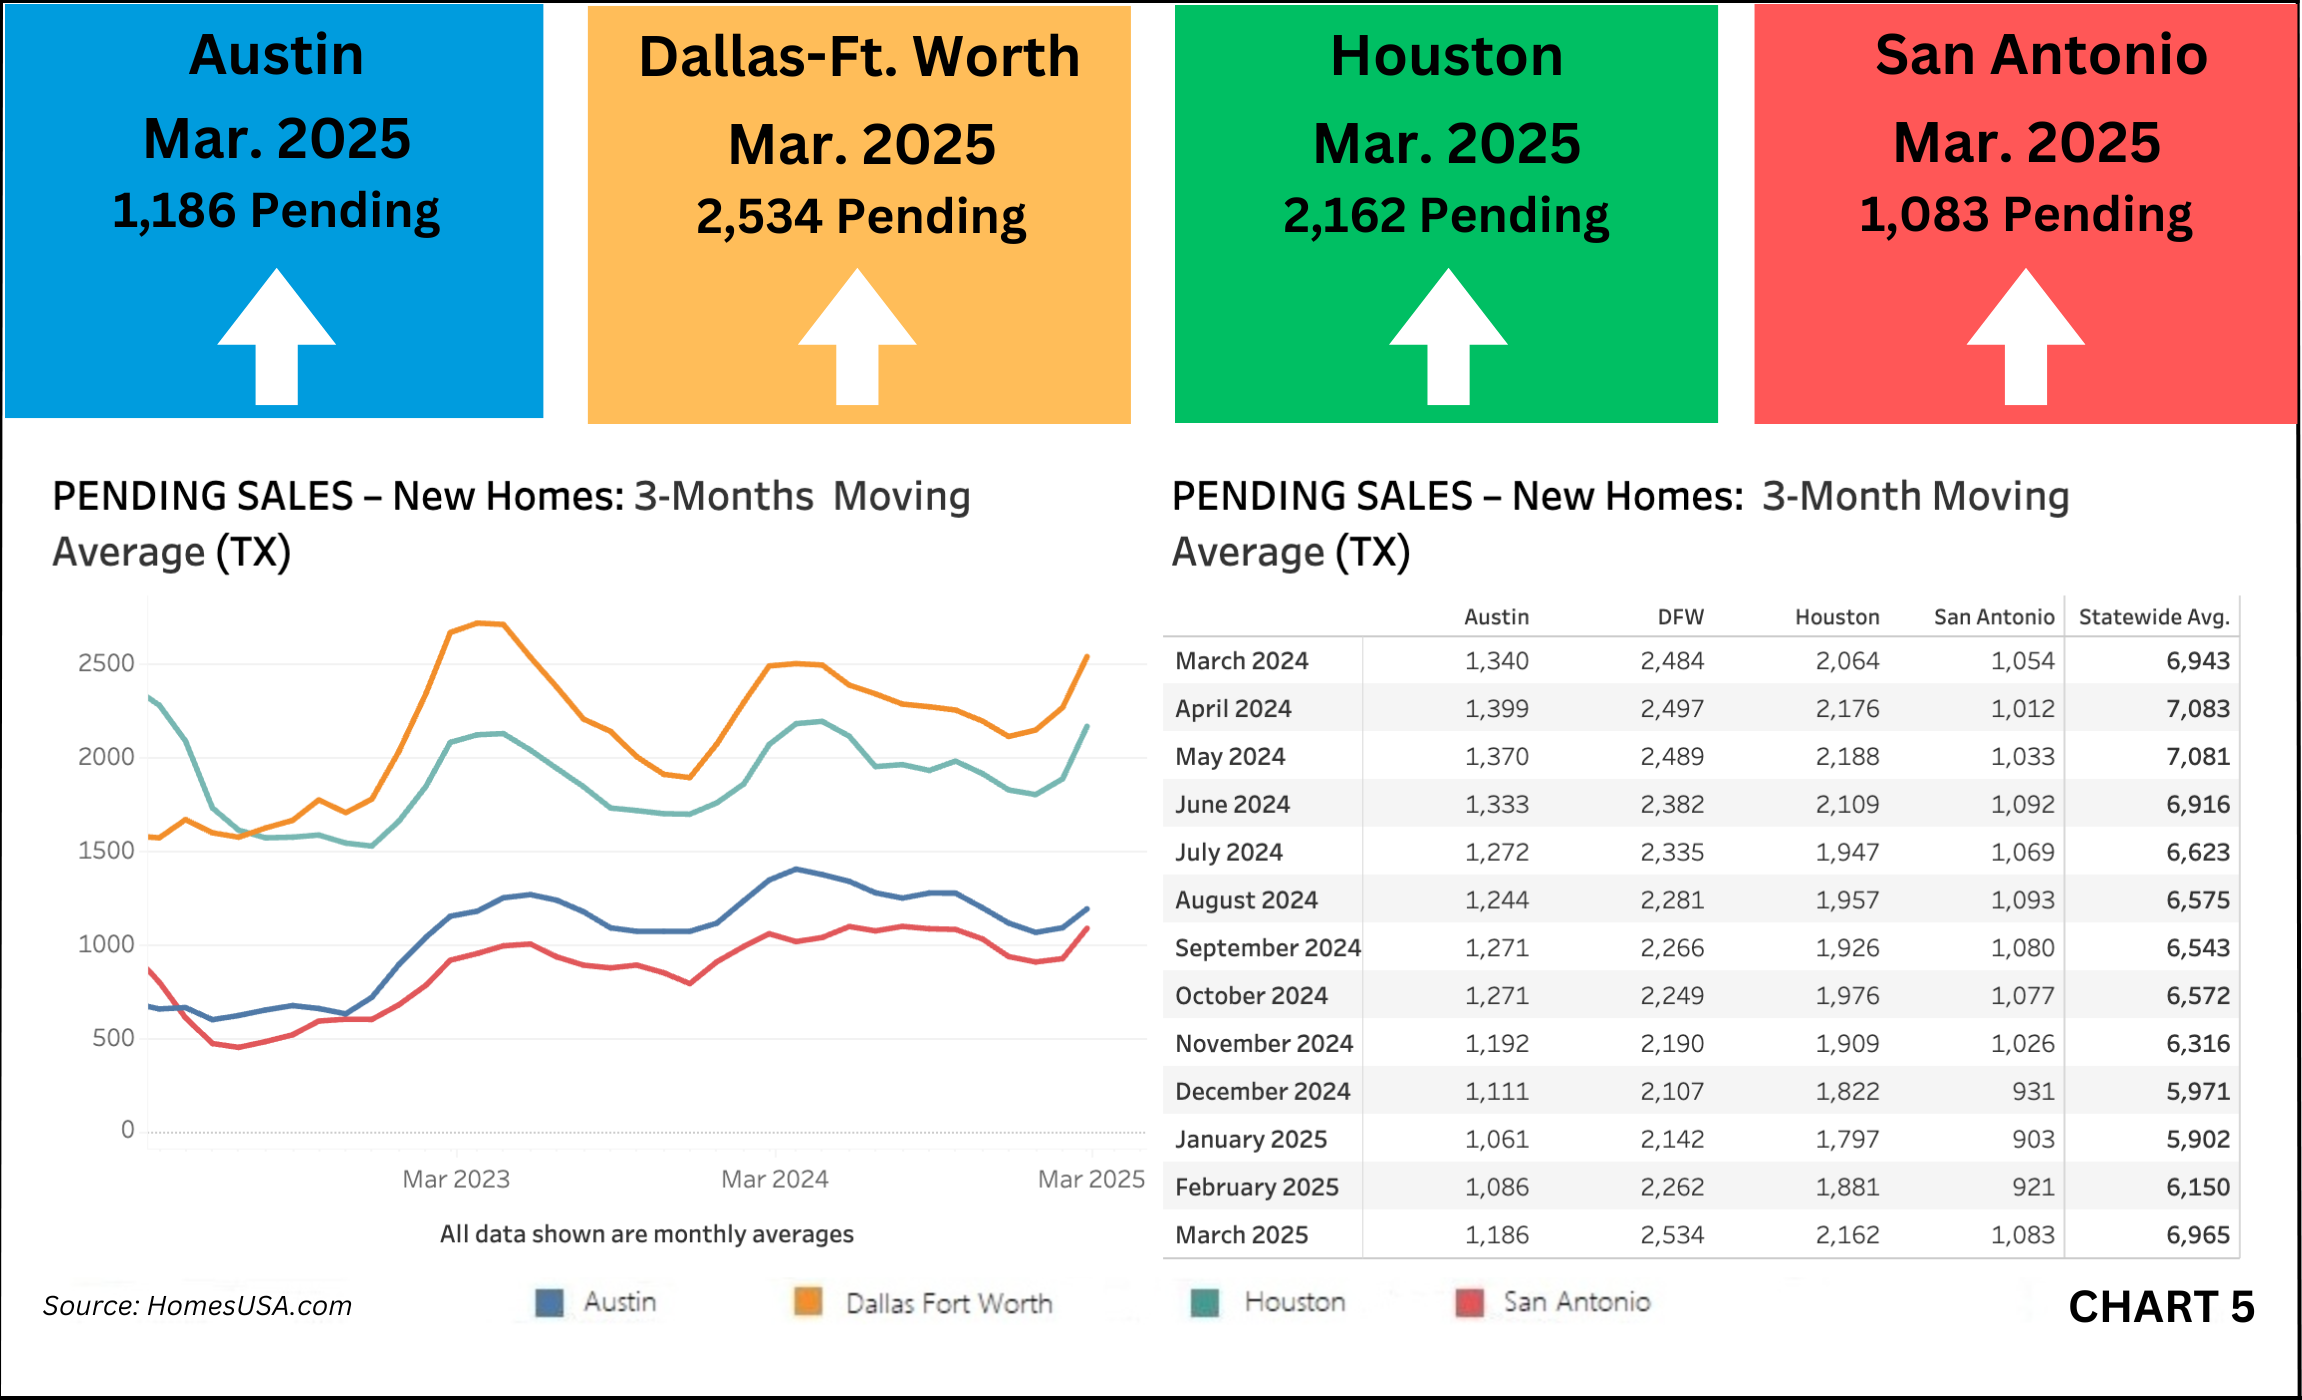
Pending new home sales last month – a key future sales indicator – continue to rise in March. Austin saw an increase to 1,186 from 1,086. Dallas-Ft. Worth also rose, hitting 2,534 from 2,262. Houston increased to 2,162 from 1,881, while San Antonio climbed to 1,083 from 921. Overall, the average of these four markets rose to 6,965 pending sales in March, up from 6,150 in February.
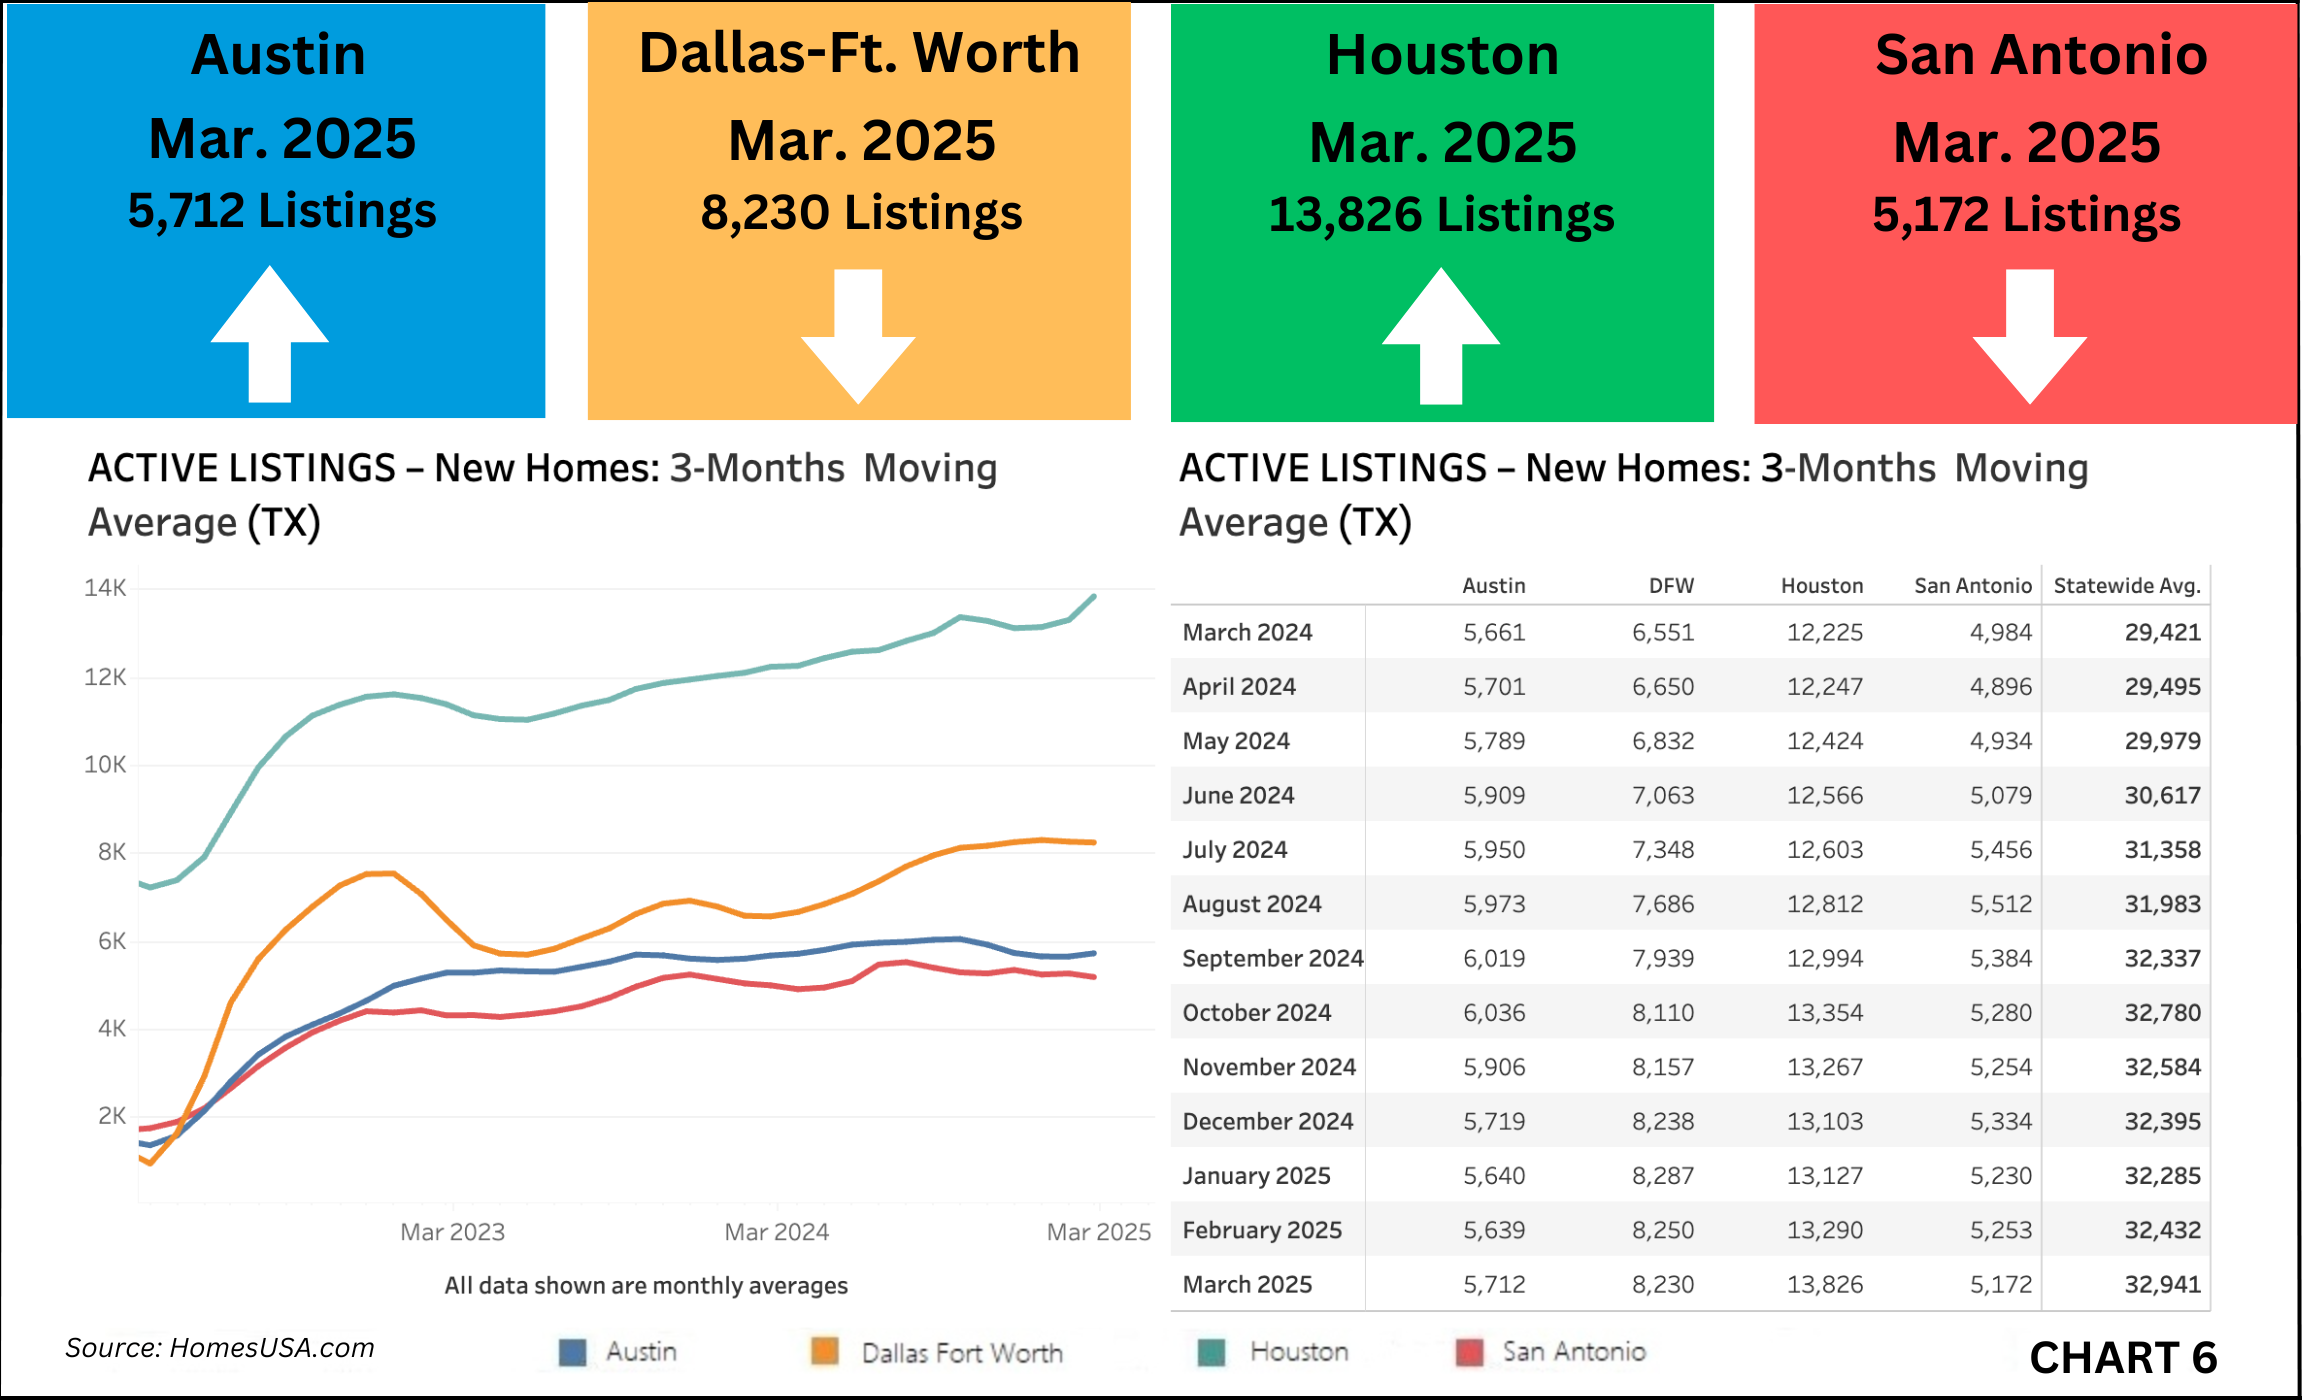
Active new home listings across Texas’s four largest markets continued their upward trend in March, indicating an increase in housing inventory.
Statewide, average active listings rose to 32,941 from 32,432 in February, the highest level recorded in the past year. Houston had the largest increase, reaching 13,826 active listings in March from 13,290. Austin listings inched up to 5,712 from 5,639; Dallas-Ft. Worth dipped slightly to 8,230 from 8,250, and San Antonio dropped modestly to 5,172 from 5,253.
HomesUSA.com is sharing its New Home Sales Report and New Home Sales Index at the same time the Commerce Department releases its nationwide New Residential Sales Report for March, set for Wednesday, April 23, 2025, at 10:00 am Eastern time.
About the Report
The HomesUSA.com monthly report covers closed sales recorded in MLSs by the 10th day of the following month. The report features 3-month and 12-month moving averages for six essential market data, including DOM, sales volume, sales prices, a sales-to-list price ratio, pending sales, and active listings. Caballero explained the 3-month moving average indices track market seasonality, while the 12-month moving average removes the seasonality and tracks the longer trend.
Days on Market Slow Down – New Homes in Texas (Exclusive Data)
The HomesUSA.com New Home Sales Index showed that the DOM’s March 3-month moving average continued to slow down in Texas’ four major new home markets. In Dallas-Ft. Worth, the DOM was 148.47 days versus 144.91 days in February. In Houston, the DOM was 92.51 days versus 90.32 days in February. In Austin, the DOM in March was 105.95 days versus 103.10 days in February. In San Antonio, the DOM was 88.74 days versus 85.70 days in February. New homes have significantly higher DOM than existing homes because most new homes are listed while under construction. Note: Each MLS may calculate Days on Market differently, so direct comparisons may not always be reliable. (See Chart 1: Texas New Homes Days on Market)
Texas New Home Sales Decrease
Based on all local MLS data, the most reliable and current source of all home sales activity, total new home sales continued to decrease in three of the four largest new home markets in Texas last month. The March 3-month moving average of new home sales in Dallas-Ft. Worth was 1,738 versus 1,788 in February. In Houston, total new home sales in March were lower at 1,980 versus 2,029 in February. In San Antonio, new home sales in March were also lower at 947 versus 961 in February. Austin was the exception, as new home sales last month were higher at 761 versus 737 in February. (See Chart 2: Texas New Home Sales)
Texas New Home Prices Drop
The average prices of new homes continued to go down in the four major new home markets in Texas last month. In Dallas-Ft. Worth, the average new home price in March was lower at $479,298 versus $494,145 in February. In Houston, the 3-month moving average price for new homes in March was $392,427 versus $396,376 in February. In Austin, the 3-month moving average price in March was also lower at $474,551 versus $479,189 in February. San Antonio’s average new home price in March was $328,130 versus $330,286 in February. (See Chart 3: Texas New Home Prices)
Texas Sales-to-List Price Ratio Remains Stable
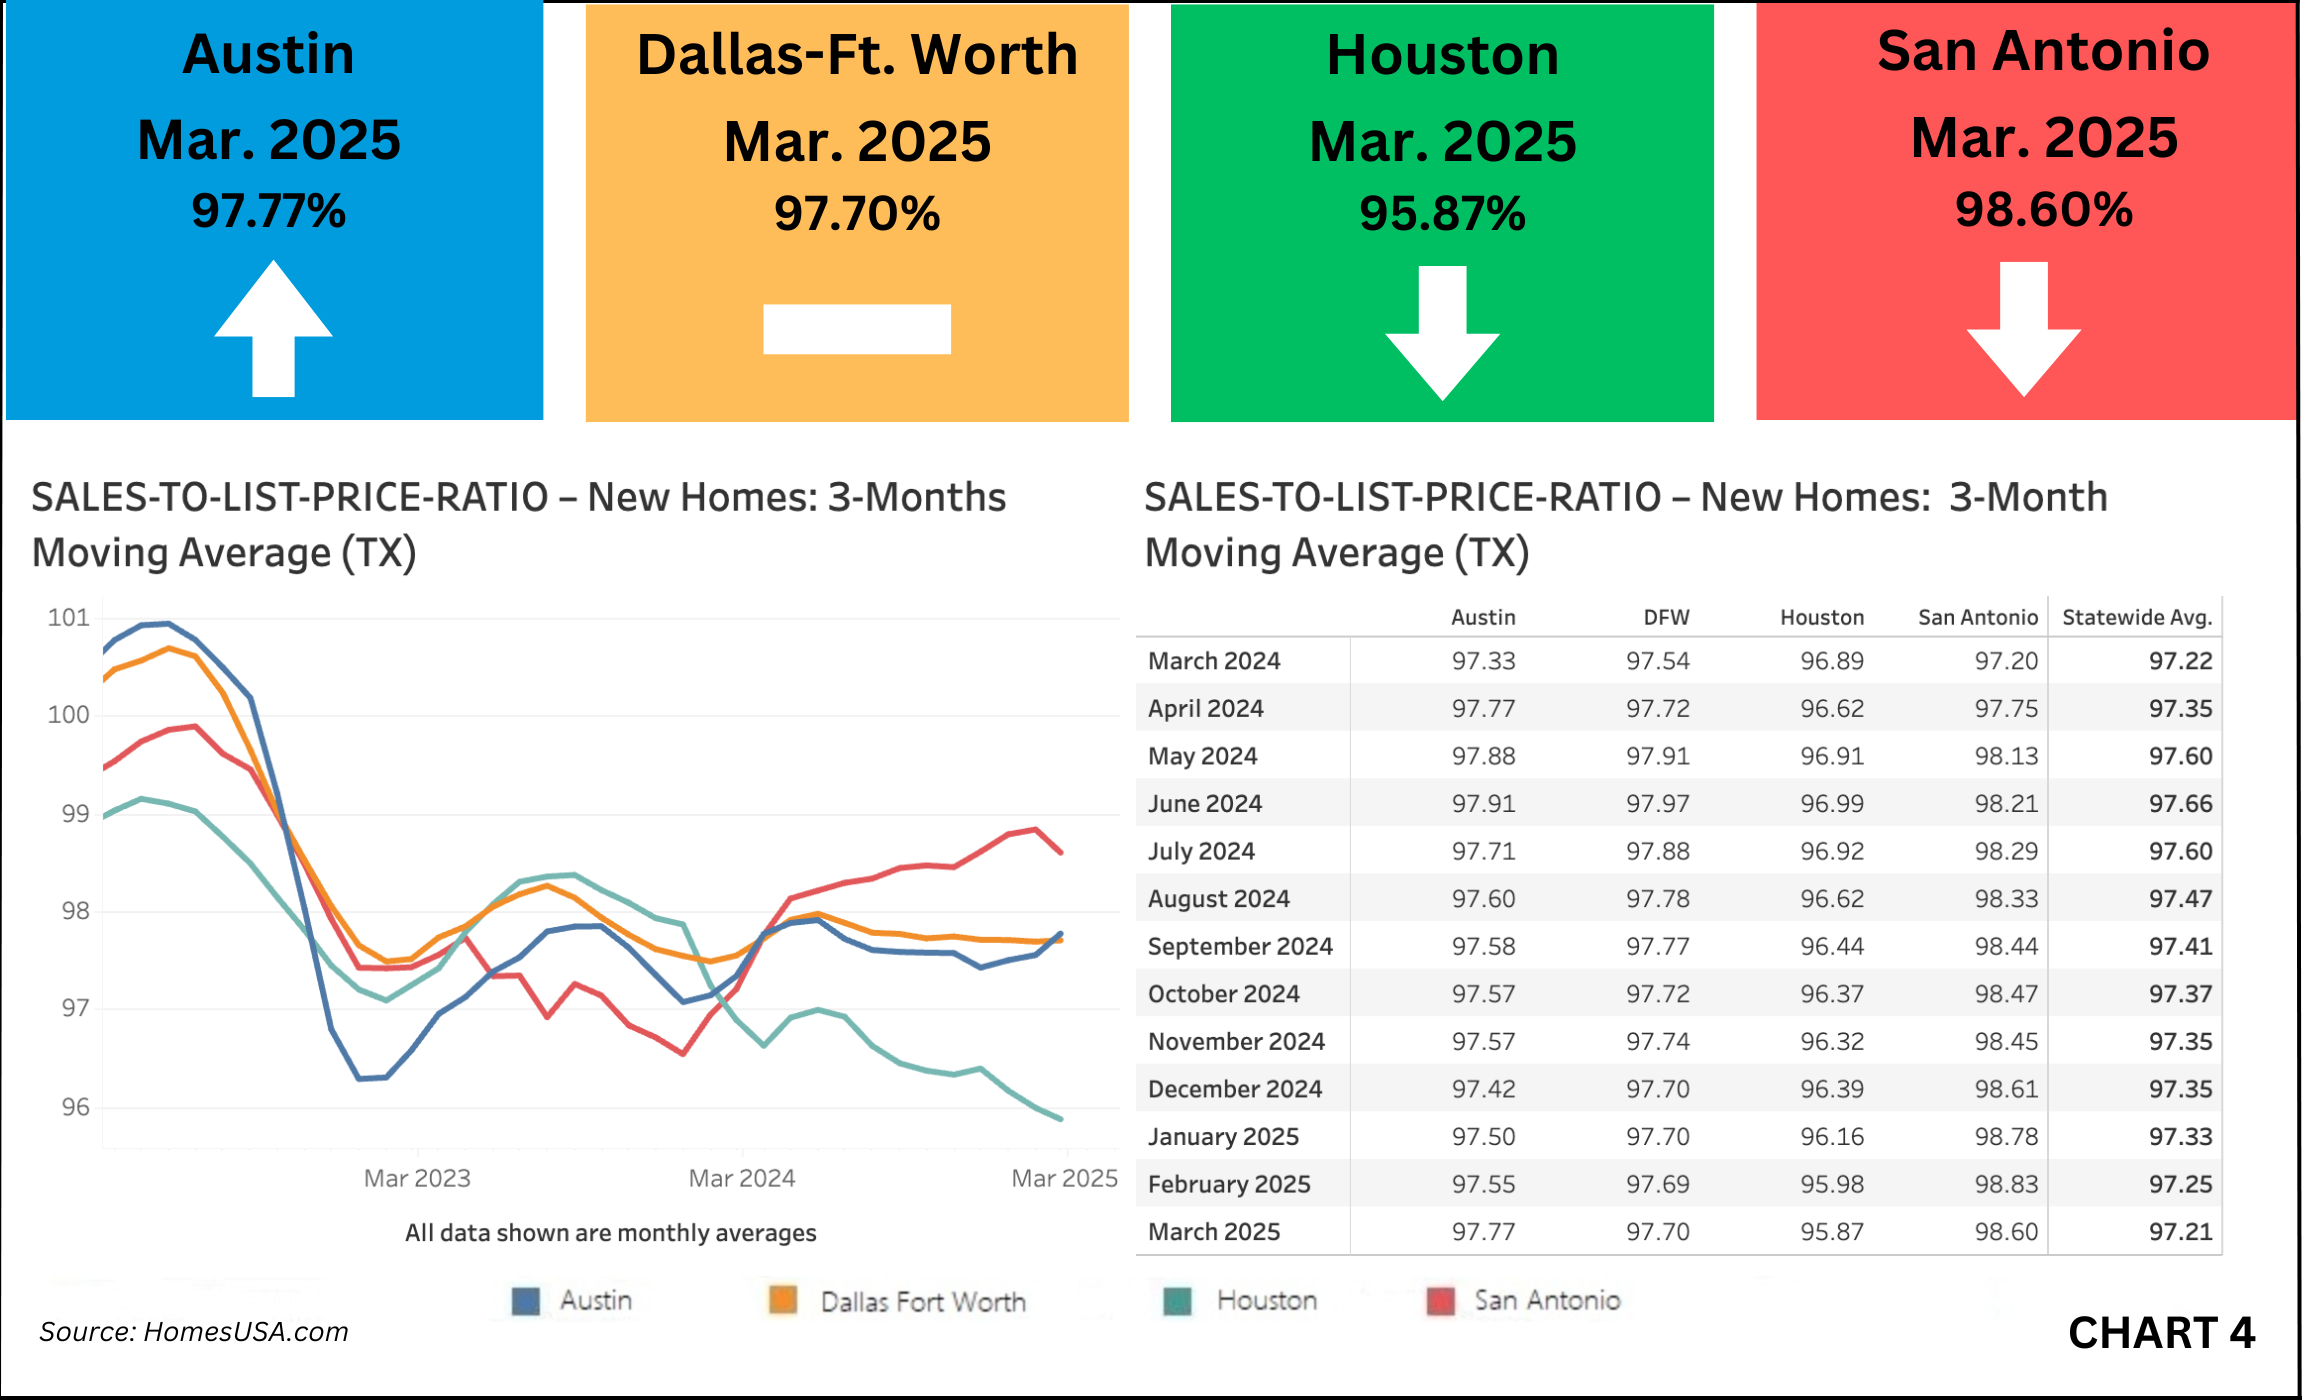
Cumulative new home sales remain slightly lower than 100 percent of the asking price. The combined 3-month moving average of the sales-to-list price ratio in Texas’ four largest markets for March was 97.21 versus 97.22 percent a year ago and 98.83 percent last month. Dallas-Ft. Worth’s ratio in March was 97.70 versus 97.54 percent a year ago and 97.69 percent last month. In Houston, the ratio in March was 95.87 versus 96.89 percent a year ago and 95.98 percent last month. In Austin, the sales-to-price ratio in March was 97.77 versus 97.33 percent a year ago and 97.55 percent last month. San Antonio’s ratio in March was 98.60 versus 97.20 percent a year ago and 98.83 percent last month. (See Chart 4: Texas Sales-to-List Price Ratio)
Texas Pending New Homes Sales Increase
Based on local MLS data, the 3-month average of pending new home sales increased in the four largest Texas new home markets. The combined four-market average in March totaled 6,965 versus 6,150 in February. In Dallas-Ft. Worth, pending new home sales last month were 2,534 versus 2,262 in February. In Houston, pending new home sales in March were higher at 2,162 versus 1,881 in February. In Austin, pending new home sales in March increased to 1,186 versus 1,086 in February. In San Antonio, pending new home sales also increased last month to 1,083 versus 921 in February. (See Chart 5: Texas Pending New Home Sales)
Texas Active Listings for New Homes Show Mixed Results
Active new home listings showed mixed results in the four of the largest Texas new home markets in March. The March 3-month average active listings inventory in Texas’ four major new home markets was 32,941 new homes versus 32,432 in February. Dallas-Ft. Worth’s active listings in March were 8,230 versus 8,250 in February. Active listings in Houston last month were 13,826 versus 13,290 in February. In Austin, active listings in March were 5,712 versus 5,639 in February. In San Antonio, active listings last month were 5,172 versus 5,253 in February. (See Chart 6: Texas Active Listings)
About the HomesUSA.com New Home Sales Index
The HomesUSA.com Index is reported as both a 3-month and 12-month moving average of the Days on Market for new homes listed in the local Multiple Listing Services (MLSs) for Dallas-Ft. Worth, Houston, Austin, and San Antonio. Created by Ben Caballero, it is the first Days on Market index to track the Texas new home market and includes homes listed while under construction. (See Chart A: 12-Month Moving Averages)
*Note: Texas data denotes a combination of its four largest new home markets – Houston, Dallas-Ft. Worth, Austin, and San Antonio – which comprise the vast majority of new home sales and MLS data statewide.
About Ben Caballero and HomesUSA.com®
Ben Caballero, founder and CEO of HomesUSA.com, is a three-time Guinness World Records title holder for ‘Most annual home sale transactions through MLS by an individual sell-side real estate agent – current.’ Ranked by REAL Trends as America’s top real estate agent for home sales since 2013, Ben is the most productive real estate agent in U.S. history. He is the only individual real estate agent to exceed $3 billion in residential sales transactions in a single year (2022), the first agent to exceed $2 billion (2018, 2019, 2020), and the first agent to exceed $1 billion (2015, 2016, 2017). Ben, an award-winning innovator and technology pioneer, works with more than 60 home builders in Dallas-Fort Worth, Houston, Austin, and San Antonio. His podcast series is available widely, including iTunes, Spotify and YouTube. Learn more at HomesUSA.com |Twitter: @bcaballero – @HomesUSA | Facebook: /HomesUSAdotcom.
Note for journalists: You may contact Ben Caballero directly by email at ben@homesusa.com.
REALTOR® is a federally registered collective membership mark which identifies a real estate professional who is a member of the NATIONAL ASSOCIATION OF REALTORS® and subscribes to its strict Code of Ethics.
Media Contact:
Kevin Hawkins
(206) 866-1220
kevin@wavgroup.com
Image: Ben Caballero (2025 – Updated)
https://bit.ly/ben-caballero-photo
Individual Chart images:
Chart 1: Texas New Homes Tracking – Days on Market – March 2025: https://homesusa.com/wp-content/uploads/2025/04/Chart-1-Texas-New-Homes-Tracking-Days-on-Market.png
Chart 2: Texas New Home Sales Market – March 2025: https://homesusa.com/wp-content/uploads/2025/04/Chart-2-Texas-New-Home-Sales-Market.png
Chart 3: Texas New Home Sales Prices Market – March 2025: https://homesusa.com/wp-content/uploads/2025/04/Chart-3-Texas-New-Home-Sales-Prices-Market.png
Chart 4: Texas Sales-to-List-Price Ratio Market – March 2025: https://homesusa.com/wp-content/uploads/2025/04/Chart-4-Texas-Sales-to-List-Price-Ratio-Market.png
Chart 5: Texas Pending New Home Sales Market – March 2025: https://homesusa.com/wp-content/uploads/2025/04/Chart-5-Texas-Pending-New-Home-Sales-Market.png
Chart 6: Texas Active Listings for New Home Market – March 2025: https://homesusa.com/wp-content/uploads/2025/04/Chart-6-Texas-Active-Listings-for-New-Homes-Market.png
Chart A: Texas 12-Month Moving Averages Market – March 2025: https://homesusa.com/wp-content/uploads/2025/04/ChartA-12MonthChart-DataOnly.jpg


![]()
© 2025 Benzinga.com. Benzinga does not provide investment advice. All rights reserved.