Halliburton HAL will release its quarterly earnings report on Tuesday, 2025-04-22. Here’s a brief overview for investors ahead of the announcement.
Analysts anticipate Halliburton to report an earnings per share (EPS) of $0.61.
The announcement from Halliburton is eagerly anticipated, with investors seeking news of surpassing estimates and favorable guidance for the next quarter.
It’s worth noting for new investors that guidance can be a key determinant of stock price movements.
Performance in Previous Earnings
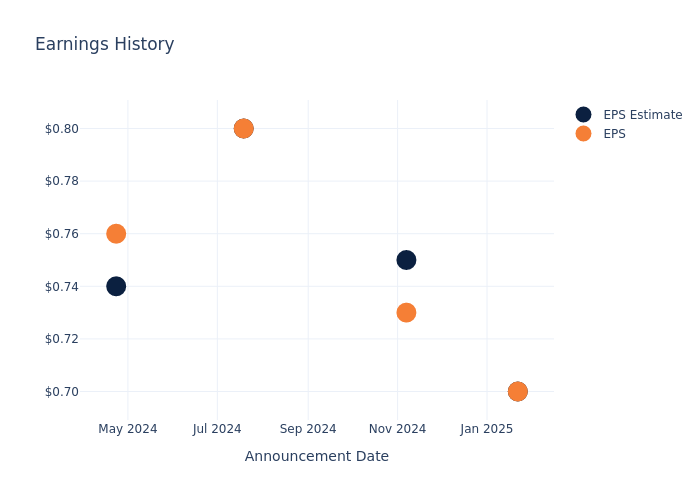
During the last quarter, the company reported an EPS missed by $0.00, leading to a 1.79% drop in the share price on the subsequent day.
Here’s a look at Halliburton’s past performance and the resulting price change:
| Quarter | Q4 2024 | Q3 2024 | Q2 2024 | Q1 2024 |
|---|---|---|---|---|
| EPS Estimate | 0.7 | 0.75 | 0.8 | 0.74 |
| EPS Actual | 0.7 | 0.73 | 0.8 | 0.76 |
| Price Change % | -2.0% | -1.0% | -6.0% | 0.0% |
Tracking Halliburton’s Stock Performance
Shares of Halliburton were trading at $22.53 as of April 18. Over the last 52-week period, shares are down 42.98%. Given that these returns are generally negative, long-term shareholders are likely a little upset going into this earnings release.
Analyst Observations about Halliburton
Understanding market sentiments and expectations within the industry is crucial for investors. This analysis delves into the latest insights on Halliburton.
Analysts have provided Halliburton with 6 ratings, resulting in a consensus rating of Neutral. The average one-year price target stands at $32.83, suggesting a potential 45.72% upside.
Peer Ratings Overview
In this analysis, we delve into the analyst ratings and average 1-year price targets of TechnipFMC, NOV and Archrock, three key industry players, offering insights into their relative performance expectations and market positioning.
- Analysts currently favor an Outperform trajectory for TechnipFMC, with an average 1-year price target of $39.33, suggesting a potential 74.57% upside.
- Analysts currently favor an Outperform trajectory for NOV, with an average 1-year price target of $18.62, suggesting a potential 17.35% downside.
- Analysts currently favor an Buy trajectory for Archrock, with an average 1-year price target of $33.0, suggesting a potential 46.47% upside.
Peer Metrics Summary
In the peer analysis summary, key metrics for TechnipFMC, NOV and Archrock are highlighted, providing an understanding of their respective standings within the industry and offering insights into their market positions and comparative performance.
| Company | Consensus | Revenue Growth | Gross Profit | Return on Equity |
|---|---|---|---|---|
| Halliburton | Neutral | -2.25% | $1.03B | 5.91% |
| TechnipFMC | Outperform | 13.94% | $387M | 7.07% |
| NOV | Outperform | -1.49% | $493M | 2.49% |
| Archrock | Buy | 25.74% | $151.17M | 4.52% |
Key Takeaway:
Halliburton ranks at the bottom for Revenue Growth and Gross Profit, while it is in the middle for Return on Equity. The Consensus rating for Halliburton is Neutral.
Get to Know Halliburton Better
Halliburton is North America’s largest oilfield service company as measured by market share. Despite industry fragmentation, it holds a leading position in the hydraulic fracturing and completions market, which makes up nearly half of its revenue. It also holds strong positions in other service offerings like drilling and completions fluids, which leverages its expertise in material science, as well as the directional drilling market. While we consider SLB the global leader in reservoir evaluation, we think Halliburton leads in any activity from the reservoir to the wellbore. The firm’s innovations have helped multiple producers lower their development costs per barrel of oil equivalent, with techniques that have been homed in over a century of operations.
Halliburton: Financial Performance Dissected
Market Capitalization: Exceeding industry standards, the company’s market capitalization places it above industry average in size relative to peers. This emphasizes its significant scale and robust market position.
Revenue Growth: Halliburton’s revenue growth over a period of 3 months has faced challenges. As of 31 December, 2024, the company experienced a revenue decline of approximately -2.25%. This indicates a decrease in the company’s top-line earnings. As compared to competitors, the company encountered difficulties, with a growth rate lower than the average among peers in the Energy sector.
Net Margin: Halliburton’s net margin surpasses industry standards, highlighting the company’s exceptional financial performance. With an impressive 10.96% net margin, the company effectively manages costs and achieves strong profitability.
Return on Equity (ROE): The company’s ROE is a standout performer, exceeding industry averages. With an impressive ROE of 5.91%, the company showcases effective utilization of equity capital.
Return on Assets (ROA): Halliburton’s ROA stands out, surpassing industry averages. With an impressive ROA of 2.42%, the company demonstrates effective utilization of assets and strong financial performance.
Debt Management: Halliburton’s debt-to-equity ratio is below industry norms, indicating a sound financial structure with a ratio of 0.82.
To track all earnings releases for Halliburton visit their earnings calendar on our site.
This article was generated by Benzinga’s automated content engine and reviewed by an editor.
© 2025 Benzinga.com. Benzinga does not provide investment advice. All rights reserved.