Baker Hughes BKR is preparing to release its quarterly earnings on Tuesday, 2025-04-22. Here’s a brief overview of what investors should keep in mind before the announcement.
Analysts expect Baker Hughes to report an earnings per share (EPS) of $0.48.
Anticipation surrounds Baker Hughes’s announcement, with investors hoping to hear about both surpassing estimates and receiving positive guidance for the next quarter.
New investors should understand that while earnings performance is important, market reactions are often driven by guidance.
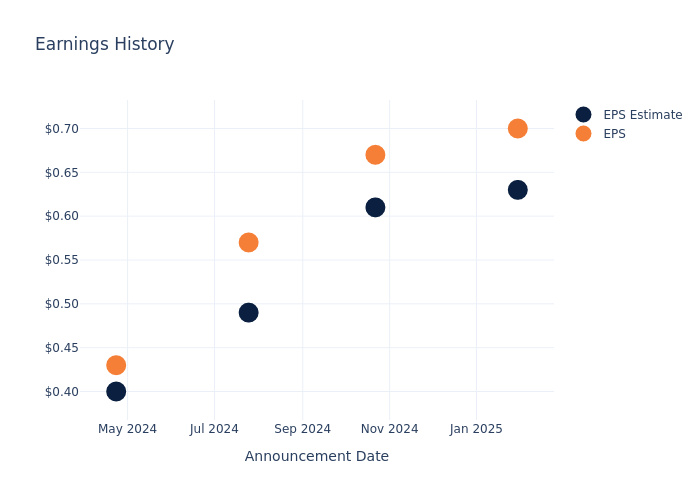
Earnings History Snapshot
The company’s EPS beat by $0.07 in the last quarter, leading to a 3.54% increase in the share price on the following day.
Here’s a look at Baker Hughes’s past performance and the resulting price change:
| Quarter | Q4 2024 | Q3 2024 | Q2 2024 | Q1 2024 |
|---|---|---|---|---|
| EPS Estimate | 0.63 | 0.61 | 0.49 | 0.40 |
| EPS Actual | 0.70 | 0.67 | 0.57 | 0.43 |
| Price Change % | 4.0% | 3.0% | 6.0% | -1.0% |
Baker Hughes Share Price Analysis
Shares of Baker Hughes were trading at $38.91 as of April 18. Over the last 52-week period, shares are up 16.27%. Given that these returns are generally positive, long-term shareholders are likely bullish going into this earnings release.
Analyst Insights on Baker Hughes
For investors, grasping market sentiments and expectations in the industry is vital. This analysis explores the latest insights regarding Baker Hughes.
A total of 13 analyst ratings have been received for Baker Hughes, with the consensus rating being Outperform. The average one-year price target stands at $53.38, suggesting a potential 37.19% upside.
Comparing Ratings Among Industry Peers
The following analysis focuses on the analyst ratings and average 1-year price targets of Schlumberger, Halliburton and TechnipFMC, three prominent industry players, providing insights into their relative performance expectations and market positioning.
- Analysts currently favor an Outperform trajectory for Schlumberger, with an average 1-year price target of $52.88, suggesting a potential 35.9% upside.
- Analysts currently favor an Neutral trajectory for Halliburton, with an average 1-year price target of $32.83, suggesting a potential 15.63% downside.
- Analysts currently favor an Outperform trajectory for TechnipFMC, with an average 1-year price target of $39.33, suggesting a potential 1.08% upside.
Peers Comparative Analysis Summary
Within the peer analysis summary, vital metrics for Schlumberger, Halliburton and TechnipFMC are presented, shedding light on their respective standings within the industry and offering valuable insights into their market positions and comparative performance.
| Company | Consensus | Revenue Growth | Gross Profit | Return on Equity |
|---|---|---|---|---|
| Baker Hughes | Outperform | 7.74% | $1.53B | 7.13% |
| Schlumberger | Outperform | 3.27% | $1.96B | 5.14% |
| Halliburton | Neutral | -2.25% | $1.03B | 5.91% |
| TechnipFMC | Outperform | 13.94% | $387M | 7.07% |
Key Takeaway:
Baker Hughes ranks highest in revenue growth among its peers. It also leads in gross profit margin. However, it has the lowest return on equity. Overall, Baker Hughes is positioned favorably compared to its peers in terms of revenue growth and gross profit, but lags behind in return on equity.
All You Need to Know About Baker Hughes
Following a 2022 reorganization, Baker Hughes operates across two segments: oilfield services and equipment, and industrial and energy technology. The firm’s oilfield services and equipment segment, or OFSE, is one of the Big Three oilfield service players, along with SLB and Halliburton, and mostly supplies to hydrocarbon developers and producers, including national oil companies, major integrated firms, and independents. Markets outside of North America buy roughly three quarters of the firm’s OFSE. Baker Hughes’ industrial and energy technology segment manufactures and sells turbines, compressors, pumps, valves, and related testing and monitoring services across various energy and industrial applications.
Breaking Down Baker Hughes’s Financial Performance
Market Capitalization Analysis: With a profound presence, the company’s market capitalization is above industry averages. This reflects substantial size and strong market recognition.
Positive Revenue Trend: Examining Baker Hughes’s financials over 3 months reveals a positive narrative. The company achieved a noteworthy revenue growth rate of 7.74% as of 31 December, 2024, showcasing a substantial increase in top-line earnings. In comparison to its industry peers, the company trails behind with a growth rate lower than the average among peers in the Energy sector.
Net Margin: Baker Hughes’s financial strength is reflected in its exceptional net margin, which exceeds industry averages. With a remarkable net margin of 16.01%, the company showcases strong profitability and effective cost management.
Return on Equity (ROE): Baker Hughes’s ROE excels beyond industry benchmarks, reaching 7.13%. This signifies robust financial management and efficient use of shareholder equity capital.
Return on Assets (ROA): Baker Hughes’s ROA excels beyond industry benchmarks, reaching 3.11%. This signifies efficient management of assets and strong financial health.
Debt Management: Baker Hughes’s debt-to-equity ratio is below industry norms, indicating a sound financial structure with a ratio of 0.36.
To track all earnings releases for Baker Hughes visit their earnings calendar on our site.
This article was generated by Benzinga’s automated content engine and reviewed by an editor.
© 2025 Benzinga.com. Benzinga does not provide investment advice. All rights reserved.