Northrop Grumman NOC is gearing up to announce its quarterly earnings on Tuesday, 2025-04-22. Here’s a quick overview of what investors should know before the release.
Analysts are estimating that Northrop Grumman will report an earnings per share (EPS) of $6.34.
Anticipation surrounds Northrop Grumman’s announcement, with investors hoping to hear about both surpassing estimates and receiving positive guidance for the next quarter.
New investors should understand that while earnings performance is important, market reactions are often driven by guidance.
Overview of Past Earnings
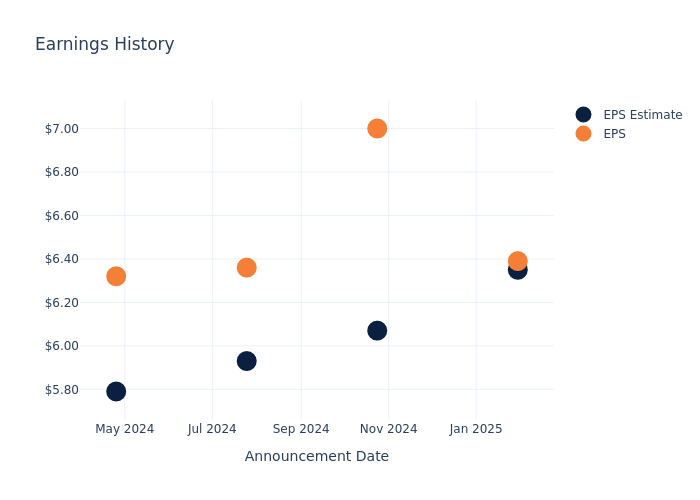
In the previous earnings release, the company beat EPS by $0.04, leading to a 0.81% increase in the share price the following trading session.
Here’s a look at Northrop Grumman’s past performance and the resulting price change:
| Quarter | Q4 2024 | Q3 2024 | Q2 2024 | Q1 2024 |
|---|---|---|---|---|
| EPS Estimate | 6.35 | 6.07 | 5.93 | 5.79 |
| EPS Actual | 6.39 | 7 | 6.36 | 6.32 |
| Price Change % | 1.0% | -1.0% | 2.0% | -2.0% |
Tracking Northrop Grumman’s Stock Performance
Shares of Northrop Grumman were trading at $540.39 as of April 18. Over the last 52-week period, shares are up 12.5%. Given that these returns are generally positive, long-term shareholders are likely bullish going into this earnings release.
Analyst Views on Northrop Grumman
Understanding market sentiments and expectations within the industry is crucial for investors. This analysis delves into the latest insights on Northrop Grumman.
A total of 10 analyst ratings have been received for Northrop Grumman, with the consensus rating being Outperform. The average one-year price target stands at $572.3, suggesting a potential 5.9% upside.
Analyzing Ratings Among Peers
The analysis below examines the analyst ratings and average 1-year price targets of General Dynamics, Howmet Aerospace and Lockheed Martin, three significant industry players, providing valuable insights into their relative performance expectations and market positioning.
- Analysts currently favor an Neutral trajectory for General Dynamics, with an average 1-year price target of $293.15, suggesting a potential 45.75% downside.
- Analysts currently favor an Outperform trajectory for Howmet Aerospace, with an average 1-year price target of $136.25, suggesting a potential 74.79% downside.
- Analysts currently favor an Neutral trajectory for Lockheed Martin, with an average 1-year price target of $508.83, suggesting a potential 5.84% downside.
Insights: Peer Analysis
The peer analysis summary offers a detailed examination of key metrics for General Dynamics, Howmet Aerospace and Lockheed Martin, providing valuable insights into their respective standings within the industry and their market positions and comparative performance.
| Company | Consensus | Revenue Growth | Gross Profit | Return on Equity |
|---|---|---|---|---|
| Northrop Grumman | Outperform | 0.45% | $1.93B | 8.42% |
| General Dynamics | Neutral | 14.31% | $2.08B | 5.10% |
| Howmet Aerospace | Outperform | 9.24% | $602M | 7.02% |
| Lockheed Martin | Neutral | -1.34% | $690M | 7.79% |
Key Takeaway:
Northrop Grumman ranks highest in Gross Profit and Return on Equity among its peers. It is in the middle for Revenue Growth.
All You Need to Know About Northrop Grumman
Northrop Grumman Corp is a diversified company which is aligned in four operating sectors, which also comprise our reportable segments namely Aeronautics Systems, Defense Systems, Mission Systems and Space Systems. The aerospace segment designs and builds military aircraft, including the F-35, Global Hawk drones, and the B-21 bomber. Defense systems develops artillery, missile systems, and missile defense technologies. Mission systems focuses on radar, navigation, and communication systems, while space systems manufactures satellites, sensors, and rocket motors.
Key Indicators: Northrop Grumman’s Financial Health
Market Capitalization Analysis: With an elevated market capitalization, the company stands out above industry averages, showcasing substantial size and market acknowledgment.
Revenue Growth: Northrop Grumman’s remarkable performance in 3 months is evident. As of 31 December, 2024, the company achieved an impressive revenue growth rate of 0.45%. This signifies a substantial increase in the company’s top-line earnings. When compared to others in the Industrials sector, the company faces challenges, achieving a growth rate lower than the average among peers.
Net Margin: Northrop Grumman’s financial strength is reflected in its exceptional net margin, which exceeds industry averages. With a remarkable net margin of 11.83%, the company showcases strong profitability and effective cost management.
Return on Equity (ROE): The company’s ROE is a standout performer, exceeding industry averages. With an impressive ROE of 8.42%, the company showcases effective utilization of equity capital.
Return on Assets (ROA): Northrop Grumman’s ROA stands out, surpassing industry averages. With an impressive ROA of 2.59%, the company demonstrates effective utilization of assets and strong financial performance.
Debt Management: The company faces challenges in debt management with a debt-to-equity ratio higher than the industry average. With a ratio of 1.08, caution is advised due to increased financial risk.
To track all earnings releases for Northrop Grumman visit their earnings calendar on our site.
This article was generated by Benzinga’s automated content engine and reviewed by an editor.
© 2025 Benzinga.com. Benzinga does not provide investment advice. All rights reserved.