Ally Financial ALLY is gearing up to announce its quarterly earnings on Thursday, 2025-04-17. Here’s a quick overview of what investors should know before the release.
Analysts are estimating that Ally Financial will report an earnings per share (EPS) of $0.44.
Investors in Ally Financial are eagerly awaiting the company’s announcement, hoping for news of surpassing estimates and positive guidance for the next quarter.
It’s worth noting for new investors that stock prices can be heavily influenced by future projections rather than just past performance.
Earnings Track Record
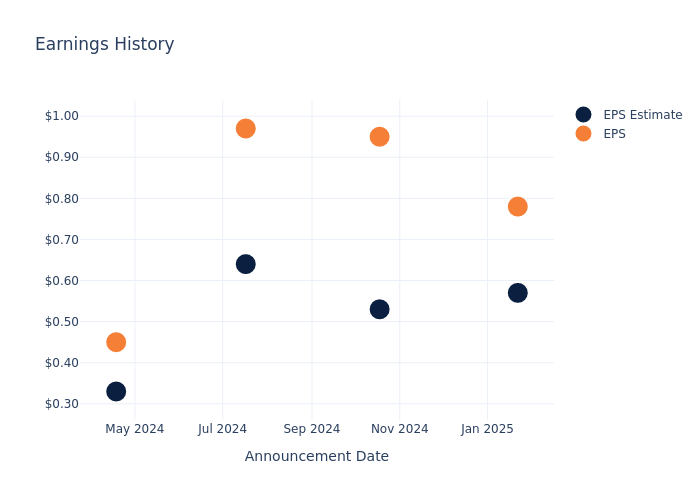
In the previous earnings release, the company beat EPS by $0.21, leading to a 1.11% increase in the share price the following trading session.
Here’s a look at Ally Financial’s past performance and the resulting price change:
| Quarter | Q4 2024 | Q3 2024 | Q2 2024 | Q1 2024 |
|---|---|---|---|---|
| EPS Estimate | 0.57 | 0.53 | 0.64 | 0.33 |
| EPS Actual | 0.78 | 0.95 | 0.97 | 0.45 |
| Price Change % | 1.0% | -2.0% | -2.0% | 1.0% |
Tracking Ally Financial’s Stock Performance
Shares of Ally Financial were trading at $32.33 as of April 15. Over the last 52-week period, shares are down 15.55%. Given that these returns are generally negative, long-term shareholders are likely a little upset going into this earnings release.
Analyst Observations about Ally Financial
For investors, grasping market sentiments and expectations in the industry is vital. This analysis explores the latest insights regarding Ally Financial.
A total of 12 analyst ratings have been received for Ally Financial, with the consensus rating being Buy. The average one-year price target stands at $42.67, suggesting a potential 31.98% upside.
Comparing Ratings with Competitors
The analysis below examines the analyst ratings and average 1-year price targets of FirstCash Hldgs and Enova International, three significant industry players, providing valuable insights into their relative performance expectations and market positioning.
- Analysts currently favor an Outperform trajectory for FirstCash Hldgs, with an average 1-year price target of $137.0, suggesting a potential 323.76% upside.
- Analysts currently favor an Buy trajectory for Enova International, with an average 1-year price target of $134.5, suggesting a potential 316.02% upside.
Insights: Peer Analysis
The peer analysis summary provides a snapshot of key metrics for FirstCash Hldgs and Enova International, illuminating their respective standings within the industry. These metrics offer valuable insights into their market positions and comparative performance.
| Company | Consensus | Revenue Growth | Gross Profit | Return on Equity |
|---|---|---|---|---|
| Credit Acceptance | Neutral | 14.89% | $351.10M | 8.95% |
| FirstCash Hldgs | Outperform | 3.72% | $433.69M | 4.12% |
| Enova International | Buy | 25.01% | $336.05M | 5.36% |
Key Takeaway:
Ally Financial ranks in the middle among its peers for revenue growth. It ranks at the top for gross profit and return on equity.
Discovering Ally Financial: A Closer Look
Formerly the captive financial arm of General Motors, Ally Financial became an independent publicly traded firm in 2014 and is one of the largest consumer auto lenders in the country. While the firm has expanded its product offerings over time, it remains primarily focused on auto lending, with more than 70% of its loan book in consumer auto loans and dealer financing. Ally also offers auto insurance, commercial loans, credit cards, and holds a portfolio of mortgage debt, giving the bank a diversified business model, which includes brokerage services.
Ally Financial: A Financial Overview
Market Capitalization Analysis: Positioned below industry benchmarks, the company’s market capitalization faces constraints in size. This could be influenced by factors such as growth expectations or operational capacity.
Revenue Growth: Ally Financial’s revenue growth over a period of 3 months has faced challenges. As of 31 December, 2024, the company experienced a revenue decline of approximately -2.18%. This indicates a decrease in the company’s top-line earnings. When compared to others in the Financials sector, the company faces challenges, achieving a growth rate lower than the average among peers.
Net Margin: Ally Financial’s net margin lags behind industry averages, suggesting challenges in maintaining strong profitability. With a net margin of -7.46%, the company may face hurdles in effective cost management.
Return on Equity (ROE): Ally Financial’s ROE falls below industry averages, indicating challenges in efficiently using equity capital. With an ROE of -1.39%, the company may face hurdles in generating optimal returns for shareholders.
Return on Assets (ROA): Ally Financial’s ROA lags behind industry averages, suggesting challenges in maximizing returns from its assets. With an ROA of -0.09%, the company may face hurdles in achieving optimal financial performance.
Debt Management: Ally Financial’s debt-to-equity ratio is below the industry average at 1.66, reflecting a lower dependency on debt financing and a more conservative financial approach.
To track all earnings releases for Ally Financial visit their earnings calendar on our site.
This article was generated by Benzinga’s automated content engine and reviewed by an editor.
© 2025 Benzinga.com. Benzinga does not provide investment advice. All rights reserved.