Bank of New York Mellon BK is preparing to release its quarterly earnings on Friday, 2025-04-11. Here’s a brief overview of what investors should keep in mind before the announcement.
Analysts expect Bank of New York Mellon to report an earnings per share (EPS) of $1.49.
The announcement from Bank of New York Mellon is eagerly anticipated, with investors seeking news of surpassing estimates and favorable guidance for the next quarter.
It’s worth noting for new investors that guidance can be a key determinant of stock price movements.
Performance in Previous Earnings
The company’s EPS beat by $0.16 in the last quarter, leading to a 0.26% increase in the share price on the following day.
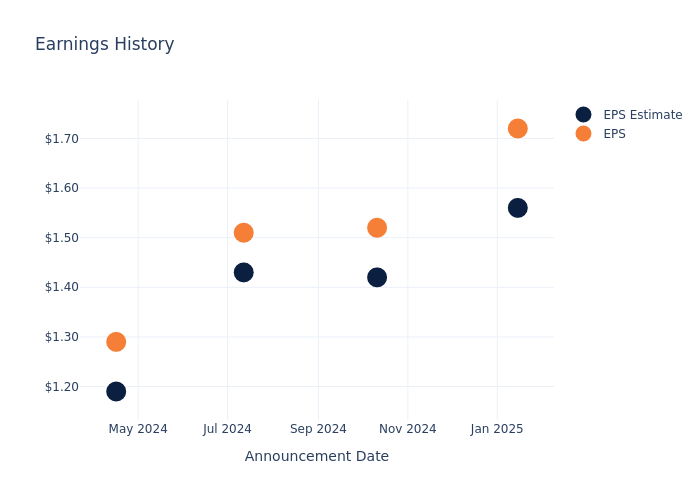
Here’s a look at Bank of New York Mellon’s past performance and the resulting price change:
| Quarter | Q4 2024 | Q3 2024 | Q2 2024 | Q1 2024 |
|---|---|---|---|---|
| EPS Estimate | 1.56 | 1.42 | 1.43 | 1.19 |
| EPS Actual | 1.72 | 1.52 | 1.51 | 1.29 |
| Price Change % | 0.0% | -0.0% | 5.0% | 1.0% |
Market Performance of Bank of New York Mellon’s Stock
Shares of Bank of New York Mellon were trading at $79.35 as of April 09. Over the last 52-week period, shares are up 40.6%. Given that these returns are generally positive, long-term shareholders are likely bullish going into this earnings release.
Analyst Views on Bank of New York Mellon
For investors, grasping market sentiments and expectations in the industry is vital. This analysis explores the latest insights regarding Bank of New York Mellon.
Analysts have given Bank of New York Mellon a total of 15 ratings, with the consensus rating being Neutral. The average one-year price target is $92.67, indicating a potential 16.79% upside.
Understanding Analyst Ratings Among Peers
The below comparison of the analyst ratings and average 1-year price targets of Ares Management, T. Rowe Price Group and KKR, three prominent players in the industry, gives insights for their relative performance expectations and market positioning.
- Analysts currently favor an Outperform trajectory for Ares Management, with an average 1-year price target of $185.55, suggesting a potential 133.84% upside.
- Analysts currently favor an Neutral trajectory for T. Rowe Price Group, with an average 1-year price target of $104.83, suggesting a potential 32.11% upside.
- Analysts currently favor an Outperform trajectory for KKR, with an average 1-year price target of $153.5, suggesting a potential 93.45% upside.
Overview of Peer Analysis
Within the peer analysis summary, vital metrics for Ares Management, T. Rowe Price Group and KKR are presented, shedding light on their respective standings within the industry and offering valuable insights into their market positions and comparative performance.
| Company | Consensus | Revenue Growth | Gross Profit | Return on Equity |
|---|---|---|---|---|
| Brookfield | Outperform | -20.77% | $5.03B | 0.93% |
| Ares Management | Outperform | 19.45% | $795.93M | -2.05% |
| T. Rowe Price Group | Neutral | 11.11% | $947.60M | 4.16% |
| KKR | Outperform | -26.81% | $948.76M | 4.72% |
Key Takeaway:
Bank of New York Mellon ranks in the middle for revenue growth among its peers. It has the highest gross profit compared to others. The return on equity of Bank of New York Mellon is higher than two peers but lower than one. Overall, Bank of New York Mellon is positioned well within its peer group based on these metrics.
All You Need to Know About Bank of New York Mellon
BNY Mellon is a global investment company involved in managing and servicing financial assets throughout the investment lifecycle. The bank provides financial services for institutions, corporations, and individual investors and delivers investment management and investment services in 35 countries and more than 100 markets. BNY Mellon is the largest global custody bank in the world, with $52.1 trillion in under custody or administration (as of December 2024), and can act as a single point of contact for clients looking to create, trade, hold, manage, service, distribute, or restructure investments. BNY Mellon’s asset-management division manages about $2.0 trillion in assets.
A Deep Dive into Bank of New York Mellon’s Financials
Market Capitalization: Boasting an elevated market capitalization, the company surpasses industry averages. This signals substantial size and strong market recognition.
Revenue Growth: Bank of New York Mellon displayed positive results in 3 months. As of 31 December, 2024, the company achieved a solid revenue growth rate of approximately 7.84%. This indicates a notable increase in the company’s top-line earnings. When compared to others in the Financials sector, the company faces challenges, achieving a growth rate lower than the average among peers.
Net Margin: Bank of New York Mellon’s net margin lags behind industry averages, suggesting challenges in maintaining strong profitability. With a net margin of 23.74%, the company may face hurdles in effective cost management.
Return on Equity (ROE): The company’s ROE is below industry benchmarks, signaling potential difficulties in efficiently using equity capital. With an ROE of 3.03%, the company may need to address challenges in generating satisfactory returns for shareholders.
Return on Assets (ROA): Bank of New York Mellon’s ROA is below industry averages, indicating potential challenges in efficiently utilizing assets. With an ROA of 0.27%, the company may face hurdles in achieving optimal financial returns.
Debt Management: Bank of New York Mellon’s debt-to-equity ratio is below the industry average at 0.85, reflecting a lower dependency on debt financing and a more conservative financial approach.
This article was generated by Benzinga’s automated content engine and reviewed by an editor.
© 2025 Benzinga.com. Benzinga does not provide investment advice. All rights reserved.