BlackRock BLK will release its quarterly earnings report on Friday, 2025-04-11. Here’s a brief overview for investors ahead of the announcement.
Analysts anticipate BlackRock to report an earnings per share (EPS) of $10.73.
The market awaits BlackRock’s announcement, with hopes high for news of surpassing estimates and providing upbeat guidance for the next quarter.
It’s important for new investors to understand that guidance can be a significant driver of stock prices.
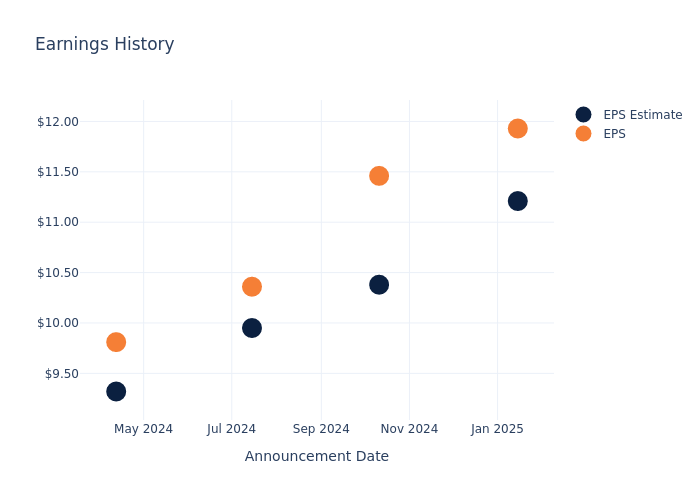
Earnings History Snapshot
During the last quarter, the company reported an EPS beat by $0.72, leading to a 1.72% drop in the share price on the subsequent day.
Here’s a look at BlackRock’s past performance and the resulting price change:
| Quarter | Q4 2024 | Q3 2024 | Q2 2024 | Q1 2024 |
|---|---|---|---|---|
| EPS Estimate | 11.21 | 10.38 | 9.95 | 9.32 |
| EPS Actual | 11.93 | 11.46 | 10.36 | 9.81 |
| Price Change % | -2.0% | 4.0% | 3.0% | -3.0% |
Market Performance of BlackRock’s Stock
Shares of BlackRock were trading at $897.08 as of April 09. Over the last 52-week period, shares are up 14.06%. Given that these returns are generally positive, long-term shareholders are likely bullish going into this earnings release.
Insights Shared by Analysts on BlackRock
For investors, staying informed about market sentiments and expectations in the industry is paramount. This analysis provides an exploration of the latest insights on BlackRock.
The consensus rating for BlackRock is Outperform, based on 14 analyst ratings. With an average one-year price target of $1116.0, there’s a potential 24.4% upside.
Peer Ratings Comparison
In this analysis, we delve into the analyst ratings and average 1-year price targets of KKR, Brookfield and Ares Management, three key industry players, offering insights into their relative performance expectations and market positioning.
- Analysts currently favor an Outperform trajectory for KKR, with an average 1-year price target of $153.5, suggesting a potential 82.89% downside.
- Analysts currently favor an Outperform trajectory for Brookfield, with an average 1-year price target of $72.8, suggesting a potential 91.88% downside.
- Analysts currently favor an Outperform trajectory for Ares Management, with an average 1-year price target of $185.55, suggesting a potential 79.32% downside.
Peer Analysis Summary
In the peer analysis summary, key metrics for KKR, Brookfield and Ares Management are highlighted, providing an understanding of their respective standings within the industry and offering insights into their market positions and comparative performance.
| Company | Consensus | Revenue Growth | Gross Profit | Return on Equity |
|---|---|---|---|---|
| BlackRock | Outperform | 22.59% | $2.80B | 3.77% |
| KKR | Outperform | -26.81% | $948.76M | 4.72% |
| Brookfield | Outperform | -20.77% | $5.03B | 0.93% |
| Ares Management | Outperform | 19.45% | $795.93M | -2.05% |
Key Takeaway:
BlackRock ranks first in revenue growth among its peers. It also leads in gross profit. However, it ranks lowest in return on equity.
Delving into BlackRock’s Background
BlackRock is the largest asset manager in the world, with $11.475 trillion in assets under management at the end of September 2024. Its product mix is fairly diverse, with 55% of managed assets in equity strategies, 26% in fixed income, 9% in multi-asset classes, 7% in money market funds, and 3% in alternatives. Passive strategies account for around two thirds of long-term AUM, with the company’s ETF platform maintaining a leading market share domestically and on a global basis. Product distribution is weighted more toward institutional clients, which by our calculations account for around 80% of AUM. BlackRock is geographically diverse, with clients in more than 100 countries and more than one third of managed assets coming from investors domiciled outside the US and Canada.
BlackRock’s Financial Performance
Market Capitalization Analysis: The company’s market capitalization surpasses industry averages, showcasing a dominant size relative to peers and suggesting a strong market position.
Revenue Growth: BlackRock’s remarkable performance in 3 months is evident. As of 31 December, 2024, the company achieved an impressive revenue growth rate of 22.59%. This signifies a substantial increase in the company’s top-line earnings. When compared to others in the Financials sector, the company excelled with a growth rate higher than the average among peers.
Net Margin: BlackRock’s net margin is below industry standards, pointing towards difficulties in achieving strong profitability. With a net margin of 29.42%, the company may encounter challenges in effective cost control.
Return on Equity (ROE): The company’s ROE is below industry benchmarks, signaling potential difficulties in efficiently using equity capital. With an ROE of 3.77%, the company may need to address challenges in generating satisfactory returns for shareholders.
Return on Assets (ROA): BlackRock’s ROA falls below industry averages, indicating challenges in efficiently utilizing assets. With an ROA of 1.23%, the company may face hurdles in generating optimal returns from its assets.
Debt Management: The company maintains a balanced debt approach with a debt-to-equity ratio below industry norms, standing at 0.3.
To track all earnings releases for BlackRock visit their earnings calendar on our site.
This article was generated by Benzinga’s automated content engine and reviewed by an editor.
© 2025 Benzinga.com. Benzinga does not provide investment advice. All rights reserved.