By Saqib Iqbal Ahmed
NEW YORK (Reuters) – Investors are looking for signs the selling in the U.S. stock market may have reached a crescendo, but say that the check marks are not yet all ticked and there is room for further pain.
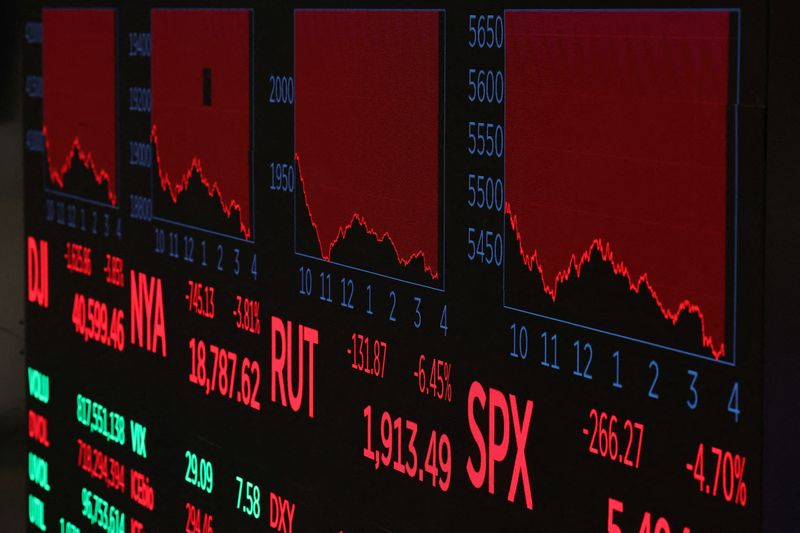
President Donald Trump’s announcement of sweeping tariffs on Wednesday extended U.S. stocks’ selloff this year with the S&P 500 down 12% from its February record high and the tech-heavy Nasdaq index down 18% – close to being in a bear market. Still, few see a market bottom.
“We’re definitely not at ‘get me out!’ levels,” Steve Sosnick, chief strategist at Interactive Brokers, said.
While investors don’t always agree on what indicators best signal a capitulation, most look at a handful of measures of investor sentiment and selling pressure.
These include the options-based Cboe Volatility Index, options indicators such as put-to-call ratios and technical barometers, including indicators of market breadth.
“Even today we aren’t at the point where investors can check the box on all the indicators,” said Brian Jacobsen, chief economist at Annex Wealth Management.
For one, the VIX, dubbed the Wall Street “fear gauge” remains shy of the levels hit at market lows.
In the last 10 instances when the S&P 500 experienced a correction – a fall of 10% or more from a recent high – the VIX on average touched a peak level of 37 before the selling was done. The index closed at 30.02 on Thursday, its first close above the 30 level in 8 months, showing increased investor anxiety but possibly not yet at capitulation point.
Another options measure – put-to-call ratio – that compares the trading volume of put options, typically used for defensive positions to call options, usually bought for bullish bets, has spiked but remains off highs.
The 1-month moving average of daily puts-to-calls traded stood near a 1-year high of 0.85 on Thursday, but well shy of the high of 1.05 touched in the last four years, according to a Reuters analysis of options data from Trade Alert data.
Measures of market breadth, including the number of stocks down versus up, also remain below extremes. On Monday, about 81% of S&P 500 constituents finished in the red.
“We’re not seeing major 90% downside levels that show that just everything is being thrown out,” Andrew Thrasher, portfolio manager for Financial Enhancement Group, said.
Historically, one-day declines of 4% or more for the S&P, have not been sure-fire markers of market bottoms, Thrasher said.
“The magnitude of a single decline isn’t symptomatic to say that we’ve seen capitulation,” he said.

