Whales with a lot of money to spend have taken a noticeably bearish stance on Goldman Sachs Gr.
Looking at options history for Goldman Sachs Gr GS we detected 47 trades.
If we consider the specifics of each trade, it is accurate to state that 34% of the investors opened trades with bullish expectations and 44% with bearish.
From the overall spotted trades, 21 are puts, for a total amount of $3,179,021 and 26, calls, for a total amount of $4,725,764.
Predicted Price Range
Analyzing the Volume and Open Interest in these contracts, it seems that the big players have been eyeing a price window from $350.0 to $820.0 for Goldman Sachs Gr during the past quarter.
Insights into Volume & Open Interest
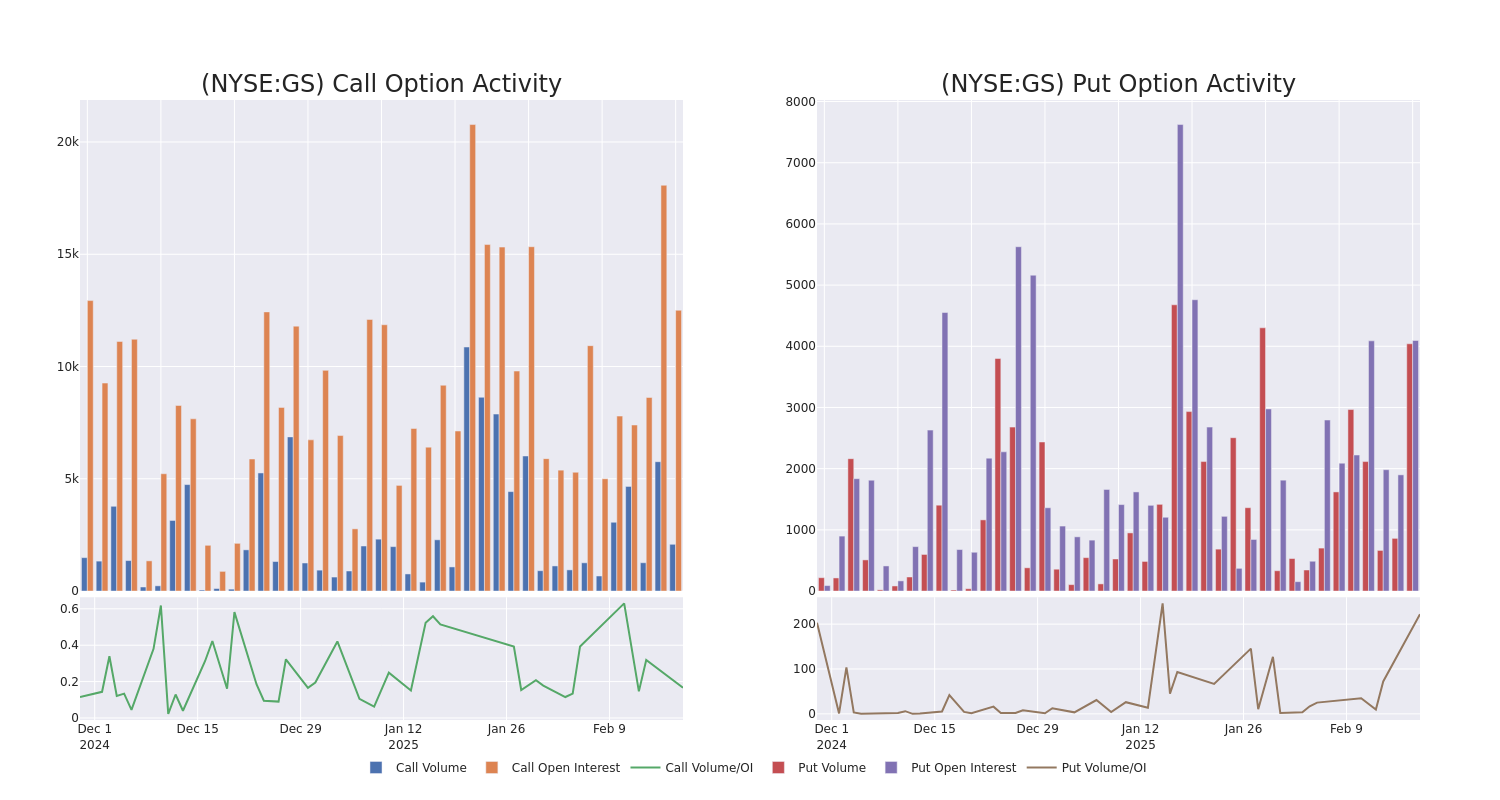
Looking at the volume and open interest is an insightful way to conduct due diligence on a stock.
This data can help you track the liquidity and interest for Goldman Sachs Gr’s options for a given strike price.
Below, we can observe the evolution of the volume and open interest of calls and puts, respectively, for all of Goldman Sachs Gr’s whale activity within a strike price range from $350.0 to $820.0 in the last 30 days.
Goldman Sachs Gr Option Activity Analysis: Last 30 Days
Noteworthy Options Activity:
| Symbol | PUT/CALL | Trade Type | Sentiment | Exp. Date | Ask | Bid | Price | Strike Price | Total Trade Price | Open Interest | Volume |
|---|---|---|---|---|---|---|---|---|---|---|---|
| GS | PUT | TRADE | NEUTRAL | 06/20/25 | $31.25 | $30.65 | $30.9 | $600.00 | $1.5M | 1.2K | 514 |
| GS | CALL | SWEEP | NEUTRAL | 12/19/25 | $176.55 | $171.0 | $173.69 | $460.00 | $1.3M | 73 | 75 |
| GS | CALL | SWEEP | NEUTRAL | 03/21/25 | $169.6 | $164.2 | $166.99 | $450.00 | $1.2M | 213 | 75 |
| GS | CALL | TRADE | BULLISH | 09/19/25 | $20.95 | $20.5 | $20.9 | $700.00 | $418.0K | 316 | 200 |
| GS | CALL | SWEEP | BULLISH | 09/19/25 | $41.75 | $41.0 | $41.63 | $640.00 | $332.6K | 219 | 82 |
About Goldman Sachs Gr
Goldman Sachs is a leading global investment banking and asset management firm. Approximately 20% of its revenue comes from investment banking, 45% from trading, 20% from asset management and 15% from wealth management and retail financial services. Around 60% of the company’s net revenue is generated in the Americas, 15% in Asia, and 25% in Europe, the Middle East, and Africa.
Current Position of Goldman Sachs Gr
- With a trading volume of 657,909, the price of GS is down by -1.84%, reaching $614.63.
- Current RSI values indicate that the stock is may be approaching oversold.
- Next earnings report is scheduled for 48 days from now.
What The Experts Say On Goldman Sachs Gr
Over the past month, 1 industry analysts have shared their insights on this stock, proposing an average target price of $720.0.
Unusual Options Activity Detected: Smart Money on the Move
Benzinga Edge’s Unusual Options board spots potential market movers before they happen. See what positions big money is taking on your favorite stocks. Click here for access.
* An analyst from Wells Fargo has decided to maintain their Overweight rating on Goldman Sachs Gr, which currently sits at a price target of $720.
Options are a riskier asset compared to just trading the stock, but they have higher profit potential. Serious options traders manage this risk by educating themselves daily, scaling in and out of trades, following more than one indicator, and following the markets closely.
If you want to stay updated on the latest options trades for Goldman Sachs Gr, Benzinga Pro gives you real-time options trades alerts.
Market News and Data brought to you by Benzinga APIs
© 2025 Benzinga.com. Benzinga does not provide investment advice. All rights reserved.