Financial giants have made a conspicuous bullish move on Newmont. Our analysis of options history for Newmont NEM revealed 33 unusual trades.
Delving into the details, we found 54% of traders were bullish, while 36% showed bearish tendencies. Out of all the trades we spotted, 5 were puts, with a value of $304,160, and 28 were calls, valued at $3,690,211.
What’s The Price Target?
Analyzing the Volume and Open Interest in these contracts, it seems that the big players have been eyeing a price window from $30.0 to $51.0 for Newmont during the past quarter.
Analyzing Volume & Open Interest
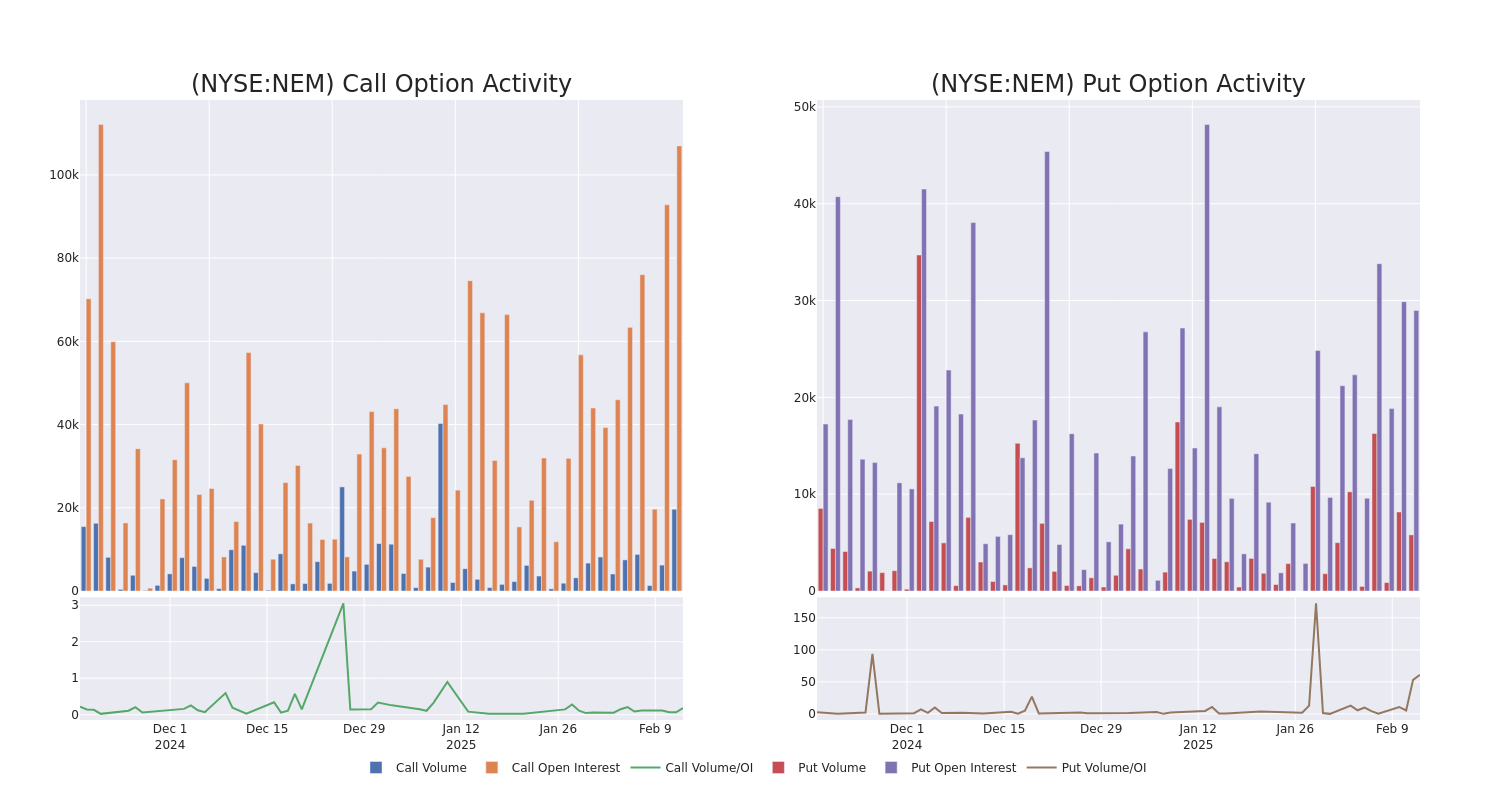
In today’s trading context, the average open interest for options of Newmont stands at 7552.5, with a total volume reaching 25,447.00. The accompanying chart delineates the progression of both call and put option volume and open interest for high-value trades in Newmont, situated within the strike price corridor from $30.0 to $51.0, throughout the last 30 days.
Newmont Option Activity Analysis: Last 30 Days
Biggest Options Spotted:
| Symbol | PUT/CALL | Trade Type | Sentiment | Exp. Date | Ask | Bid | Price | Strike Price | Total Trade Price | Open Interest | Volume |
|---|---|---|---|---|---|---|---|---|---|---|---|
| NEM | CALL | SWEEP | BEARISH | 03/21/25 | $5.45 | $5.35 | $5.38 | $42.50 | $1.6M | 17.7K | 3.1K |
| NEM | CALL | SWEEP | BULLISH | 01/16/26 | $12.2 | $12.15 | $12.2 | $37.50 | $488.0K | 27.5K | 835 |
| NEM | CALL | SWEEP | BULLISH | 01/16/26 | $12.1 | $12.1 | $12.1 | $37.50 | $484.0K | 27.5K | 435 |
| NEM | CALL | TRADE | BEARISH | 06/20/25 | $12.65 | $12.5 | $12.55 | $35.00 | $138.0K | 2.3K | 110 |
| NEM | CALL | SWEEP | NEUTRAL | 02/21/25 | $2.88 | $2.61 | $2.74 | $45.00 | $137.0K | 10.3K | 501 |
About Newmont
Newmont is the world’s largest gold miner. It bought Goldcorp in 2019, combined its Nevada mines in a joint venture with competitor Barrick later that year, and also purchased competitor Newcrest in November 2023. Its portfolio includes 17 wholly or majority owned mines and interests in two joint ventures in the Americas, Africa, Australia and Papua New Guinea. The company is expected to produce roughly 5.5 million ounces of gold in 2024 from its core mines and 6.8 million in total. It is likely to sell a number of its higher cost, smaller mines accounting for 20% of forecast sales in 2024. Newmont also produces material amounts of copper, silver, zinc, and lead as byproducts. It had about two decades of gold reserves along with significant byproduct reserves at the end of December 2023.
After a thorough review of the options trading surrounding Newmont, we move to examine the company in more detail. This includes an assessment of its current market status and performance.
Newmont’s Current Market Status
- With a volume of 4,044,578, the price of NEM is up 0.78% at $47.17.
- RSI indicators hint that the underlying stock may be overbought.
- Next earnings are expected to be released in 7 days.
Professional Analyst Ratings for Newmont
1 market experts have recently issued ratings for this stock, with a consensus target price of $50.0.
Unusual Options Activity Detected: Smart Money on the Move
Benzinga Edge’s Unusual Options board spots potential market movers before they happen. See what positions big money is taking on your favorite stocks. Click here for access.
* Consistent in their evaluation, an analyst from Scotiabank keeps a Sector Perform rating on Newmont with a target price of $50.
Options trading presents higher risks and potential rewards. Astute traders manage these risks by continually educating themselves, adapting their strategies, monitoring multiple indicators, and keeping a close eye on market movements. Stay informed about the latest Newmont options trades with real-time alerts from Benzinga Pro.
Market News and Data brought to you by Benzinga APIs
© 2025 Benzinga.com. Benzinga does not provide investment advice. All rights reserved.