In today’s fast-paced and competitive business landscape, it is essential for investors and industry enthusiasts to thoroughly analyze companies before making investment decisions. In this article, we will conduct a comprehensive industry comparison, evaluating KKR KKR against its key competitors in the Capital Markets industry. By examining key financial metrics, market position, and growth prospects, we aim to provide valuable insights for investors and shed light on company’s performance within the industry.
KKR Background
KKR is one of the world’s largest alternative asset managers, with $624.4 billion in total managed assets, including $505.7 billion in fee-earning AUM, at the end of September 2024. The company has two core segments: asset management (which includes private markets—private equity, credit, infrastructure, energy, and real estate—and public markets—primarily credit and hedge/investment fund platforms) and insurance (following the firm’s initial investment in, and then ultimate purchase of, Global Atlantic Financial Group, which is engaged in retirement/annuity and life insurance lines as well as reinsurance).
| Company | P/E | P/B | P/S | ROE | EBITDA (in billions) | Gross Profit (in billions) | Revenue Growth |
|---|---|---|---|---|---|---|---|
| KKR & Co Inc | 45.10 | 5.46 | 6.42 | 2.62% | $2.45 | $0.89 | 44.56% |
| Brookfield Corp | 129.13 | 2.11 | 1.01 | 0.05% | $8.4 | $5.28 | -15.62% |
| Ares Management Corp | 93.13 | 18.47 | 7.25 | -3.78% | $0.56 | $1.0 | 41.84% |
| T. Rowe Price Group Inc | 11.98 | 2.36 | 3.45 | 5.82% | $0.65 | $0.94 | 6.88% |
| Blue Owl Capital Inc | 131.94 | 6.74 | 6.25 | 1.59% | $0.22 | $0.33 | 39.85% |
| SEI Investments Co | 19.12 | 4.75 | 5.23 | 6.76% | $0.22 | $0.29 | 3.68% |
| Franklin Resources Inc | 31.67 | 0.85 | 1.20 | 1.19% | $0.48 | $1.83 | 13.08% |
| Janus Henderson Group PLC | 17.51 | 1.51 | 2.82 | 2.54% | $0.1 | $0.43 | 13.36% |
| Hamilton Lane Inc | 30.76 | 10.71 | 13.05 | 9.38% | $0.08 | $0.11 | 18.22% |
| Affiliated Managers Group Inc | 11.63 | 1.59 | 3.11 | 3.72% | $0.26 | $0.3 | -1.68% |
| Victory Capital Holdings Inc | 15.98 | 3.97 | 5.16 | 7.14% | $0.13 | $0.17 | 7.6% |
| Average | 49.28 | 5.31 | 4.85 | 3.44% | $1.11 | $1.07 | 12.72% |
When closely examining KKR, the following trends emerge:
-
The stock’s Price to Earnings ratio of 45.1 is lower than the industry average by 0.92x, suggesting potential value in the eyes of market participants.
-
It could be trading at a premium in relation to its book value, as indicated by its Price to Book ratio of 5.46 which exceeds the industry average by 1.03x.
-
The stock’s relatively high Price to Sales ratio of 6.42, surpassing the industry average by 1.32x, may indicate an aspect of overvaluation in terms of sales performance.
-
The company has a lower Return on Equity (ROE) of 2.62%, which is 0.82% below the industry average. This indicates potential inefficiency in utilizing equity to generate profits, which could be attributed to various factors.
-
The company has higher Earnings Before Interest, Taxes, Depreciation, and Amortization (EBITDA) of $2.45 Billion, which is 2.21x above the industry average, indicating stronger profitability and robust cash flow generation.
-
With lower gross profit of $890 Million, which indicates 0.83x below the industry average, the company may experience lower revenue after accounting for production costs.
-
The company is experiencing remarkable revenue growth, with a rate of 44.56%, outperforming the industry average of 12.72%.
Debt To Equity Ratio
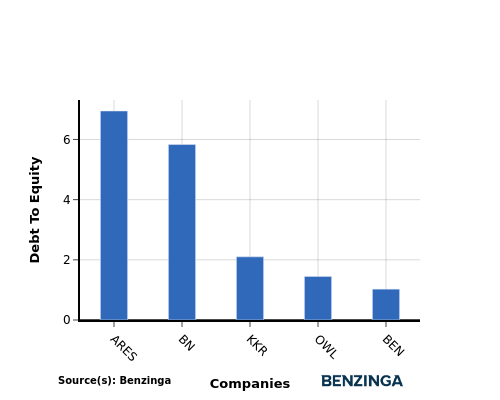
The debt-to-equity (D/E) ratio is an important measure to assess the financial structure and risk profile of a company.
Considering the debt-to-equity ratio in industry comparisons allows for a concise evaluation of a company’s financial health and risk profile, aiding in informed decision-making.
By considering the Debt-to-Equity ratio, KKR can be compared to its top 4 peers, leading to the following observations:
-
When compared to its top 4 peers, KKR has a moderate debt-to-equity ratio of 2.1.
-
This implies that the company maintains a balanced financial structure with a reasonable level of debt and an appropriate reliance on equity financing.
Key Takeaways
For KKR, the PE ratio is low compared to peers, indicating potential undervaluation. The high PB and PS ratios suggest strong market sentiment and revenue multiples. However, the low ROE implies lower profitability relative to peers. KKR’s high EBITDA and revenue growth show strong operational performance, despite the low gross profit margin. Overall, KKR’s valuation reflects a mix of positive market sentiment and operational efficiency within the Capital Markets industry.
This article was generated by Benzinga’s automated content engine and reviewed by an editor.
Overview Rating:
Speculative
Market News and Data brought to you by Benzinga APIs
© 2025 Benzinga.com. Benzinga does not provide investment advice. All rights reserved.