In today’s fast-paced and highly competitive business world, it is crucial for investors and industry followers to conduct comprehensive company evaluations. In this article, we will delve into an extensive industry comparison, evaluating Amazon.com AMZN in relation to its major competitors in the Broadline Retail industry. By closely examining key financial metrics, market standing, and growth prospects, our objective is to provide valuable insights and highlight company’s performance in the industry.
Amazon.com Background
Amazon is the leading online retailer and marketplace for third party sellers. Retail related revenue represents approximately 75% of total, followed by Amazon Web Services’ cloud computing, storage, database, and other offerings (15%), advertising services (5% to 10%), and other the remainder. International segments constitute 25% to 30% of Amazon’s non-AWS sales, led by Germany, the United Kingdom, and Japan.
| Company | P/E | P/B | P/S | ROE | EBITDA (in billions) | Gross Profit (in billions) | Revenue Growth |
|---|---|---|---|---|---|---|---|
| Amazon.com Inc | 51.72 | 9.82 | 4.17 | 6.19% | $32.08 | $31.0 | 11.04% |
| Alibaba Group Holding Ltd | 20.93 | 1.83 | 1.90 | 4.64% | $54.02 | $92.47 | 5.21% |
| PDD Holdings Inc | 11.16 | 4.09 | 3.25 | 9.38% | $29.18 | $59.65 | 44.33% |
| MercadoLibre Inc | 69.76 | 24.91 | 5.45 | 10.37% | $0.72 | $2.44 | 35.27% |
| JD.com Inc | 13.15 | 1.88 | 0.41 | 5.22% | $15.92 | $45.04 | 5.12% |
| Coupang Inc | 41.68 | 10.18 | 1.48 | 1.74% | $0.28 | $2.27 | 27.2% |
| eBay Inc | 16.86 | 5.92 | 3.33 | 11.59% | $0.95 | $1.85 | 3.04% |
| Vipshop Holdings Ltd | 7.03 | 1.46 | 0.53 | 2.76% | $1.47 | $4.96 | -9.18% |
| MINISO Group Holding Ltd | 23.94 | 5.65 | 3.91 | 6.68% | $0.88 | $2.03 | 19.29% |
| Dillard’s Inc | 12.06 | 3.79 | 1.13 | 6.37% | $0.21 | $0.63 | -3.53% |
| Ollie’s Bargain Outlet Holdings Inc | 31.39 | 4 | 2.89 | 2.24% | $0.06 | $0.21 | 7.79% |
| Macy’s Inc | 24.72 | 1.01 | 0.18 | 0.66% | $0.29 | $2.04 | -2.68% |
| Nordstrom Inc | 15.35 | 4.06 | 0.27 | 4.75% | $0.3 | $1.31 | 4.34% |
| Savers Value Village Inc | 23.91 | 4.06 | 1.21 | 5.09% | $0.07 | $0.22 | 0.53% |
| Kohl’s Corp | 5.95 | 0.39 | 0.09 | 0.58% | $0.28 | $1.57 | -8.49% |
| Groupon Inc | 16.41 | 11.26 | 0.84 | 34.72% | $0.03 | $0.1 | -9.48% |
| Hour Loop Inc | 46.40 | 12.19 | 0.57 | 7.3% | $0.0 | $0.02 | 6.6% |
| Average | 23.79 | 6.04 | 1.72 | 7.13% | $6.54 | $13.55 | 7.83% |
By carefully studying Amazon.com, we can deduce the following trends:
-
Notably, the current Price to Earnings ratio for this stock, 51.72, is 2.17x above the industry norm, reflecting a higher valuation relative to the industry.
-
It could be trading at a premium in relation to its book value, as indicated by its Price to Book ratio of 9.82 which exceeds the industry average by 1.63x.
-
With a relatively high Price to Sales ratio of 4.17, which is 2.42x the industry average, the stock might be considered overvalued based on sales performance.
-
The company has a lower Return on Equity (ROE) of 6.19%, which is 0.94% below the industry average. This indicates potential inefficiency in utilizing equity to generate profits, which could be attributed to various factors.
-
With higher Earnings Before Interest, Taxes, Depreciation, and Amortization (EBITDA) of $32.08 Billion, which is 4.91x above the industry average, the company demonstrates stronger profitability and robust cash flow generation.
-
The company has higher gross profit of $31.0 Billion, which indicates 2.29x above the industry average, indicating stronger profitability and higher earnings from its core operations.
-
With a revenue growth of 11.04%, which surpasses the industry average of 7.83%, the company is demonstrating robust sales expansion and gaining market share.
Debt To Equity Ratio
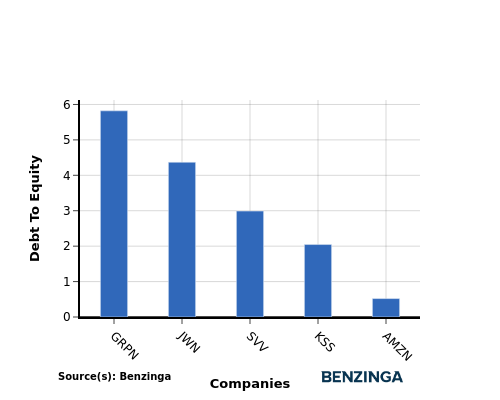
The debt-to-equity (D/E) ratio provides insights into the proportion of debt a company has in relation to its equity and asset value.
Considering the debt-to-equity ratio in industry comparisons allows for a concise evaluation of a company’s financial health and risk profile, aiding in informed decision-making.
By analyzing Amazon.com in relation to its top 4 peers based on the Debt-to-Equity ratio, the following insights can be derived:
-
Amazon.com is in a relatively stronger financial position compared to its top 4 peers, as evidenced by its lower debt-to-equity ratio of 0.52.
-
This implies that the company relies less on debt financing and has a more favorable balance between debt and equity.
Key Takeaways
For Amazon.com, the PE, PB, and PS ratios are all high compared to its peers in the Broadline Retail industry, indicating that the stock may be overvalued. The low ROE suggests that Amazon.com is not generating significant returns on shareholder equity. However, the high EBITDA, gross profit, and revenue growth show that the company is performing well in terms of operational efficiency and revenue generation compared to its industry peers.
This article was generated by Benzinga’s automated content engine and reviewed by an editor.
Market News and Data brought to you by Benzinga APIs
© 2025 Benzinga.com. Benzinga does not provide investment advice. All rights reserved.