AT&T Inc T will be reporting its fourth-quarter earnings on Monday. Wall Street expects 50 cents in EPS and $32.04 billion in revenues as the company reports before market hours.
The stock is up 36% over the past year, 18.40% over the past six months.
Let’s look at what the charts indicate for AT&T stock and how the stock currently maps against Wall Street estimates.
AT&T Stock Chart Strongly Bullish Ahead Of Q4 Earnings
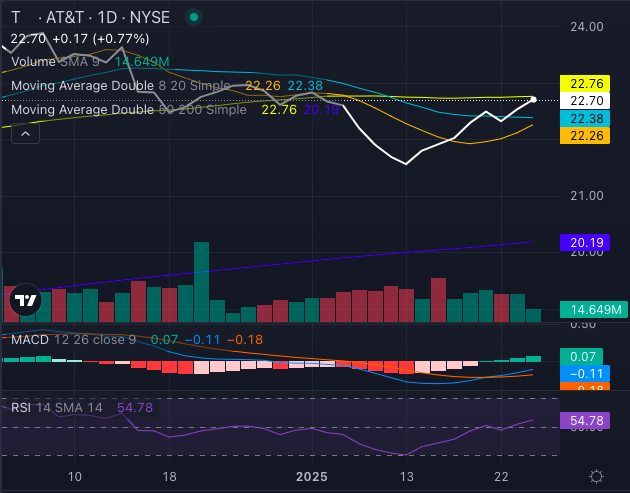
AT&T Inc T is exhibiting a strongly bullish trend, with its share price above the five-day, 20-day and 50-day exponential moving averages, indicating slight buying pressure.

Chart created using Benzinga Pro
AT&T stock at $22.70, surpassing its eight-day simple moving average of $22.26 and 20-day simple moving average (SMA) of $22.38, reinforcing a bullish outlook in the near term. However, it remains below the 50-day SMA of $22.76, presenting a short-term bearish signal.
On a broader scale, AT&T stock continues to show strength, with its 200-day simple moving average at $20.19 confirming long-term upward momentum. The moving average convergence divergence (MACD) indicator at a negative 0.11 suggests some caution, while the relative strength index (RSI) at 54.78 indicates neutral momentum.
For investors, the mixed technical signals suggest a potential for continued gains but also highlight the importance of monitoring short-term resistance levels. Those with a long-term perspective may find the current trend supportive of bullish positioning, while short-term traders should watch for confirmation of a breakout above the 50-day moving average.
AT&T Analysts See 22% Upside
Ratings & Consensus Estimates: The consensus analyst rating on AT&T stock stands at a Buy currently with a price target of $23.52. The latest analyst ratings from Argus Research, RBC Capital, and UBS suggest a 21.96% upside for AT&T stock, with an average price target of $27.67.
T Price Action: AT&T stock was trading at $22.68 at the time of publication.
Read Next:
Overview Rating:
Speculative
Market News and Data brought to you by Benzinga APIs
© 2025 Benzinga.com. Benzinga does not provide investment advice. All rights reserved.
