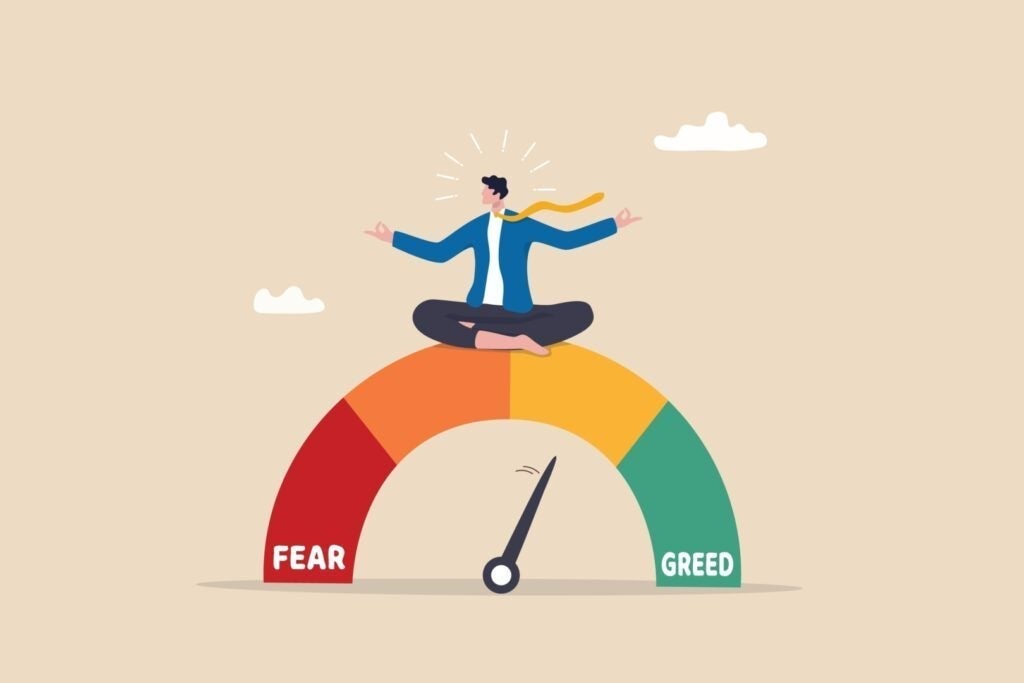
The CNN Money Fear and Greed index showed some decline in the overall market sentiment, while the index remained in the “Greed” zone on Monday.
U.S. stocks settled higher on Monday, with the S&P 500 and Nasdaq Composite surging to fresh highs during the session.
Shares of Tesla, Inc. TSLA gained 3.5% on Monday after Roth MKM upgraded the stock from Neutral to Buy and raised its price target to $380. Super Micro Computer, Inc. SMCI shares jumped around 29% after the company announced it completed a review by an independent special committee and stated EY’s conclusions were not supported by findings.
The Dow gained 1.4% last week, recording a gain of 7.5% for November. The S&P 500 gained 1.1% on the week, surging by more than 5% last month. The Dow and S&P 500 recorded their best months of the year.
On the economic data front, U.S. construction spending increased by 0.4% month-over-month to an annual rate of $2,174 billion in October compared to a 0.1% gain in September. The ISM manufacturing PMI rose to 48.4 in November versus 46.5 in the previous month, beating market estimates of 47.5.
Most sectors on the S&P 500 closed on a negative note, with utilities, real estate, and financial stocks recording the biggest losses on Monday. However, communication services and consumer discretionary stocks bucked the overall market trend, closing the session higher.
The Dow Jones closed lower by around 129 points to 44,782.00 on Monday. The S&P 500 rose 0.24% to 6,047.15, while the Nasdaq Composite climbed 0.97% to close at at 19,403.95 during Monday’s session.
Investors are awaiting earnings results from Core & Main, Inc. CNM, Marvell Technology, Inc. MRVL, and Salesforce, Inc. CRM today.
What is CNN Business Fear & Greed Index?
At a current reading of 66.6, the index remained in the “Greed” zone on Monday, versus a prior reading of 67.1.
The Fear & Greed Index is a measure of the current market sentiment. It is based on the premise that higher fear exerts pressure on stock prices, while higher greed has the opposite effect. The index is calculated based on seven equal-weighted indicators. The index ranges from 0 to 100, where 0 represents maximum fear and 100 signals maximum greediness.
Read Next:
Photo courtesy: Shutterstock
Market News and Data brought to you by Benzinga APIs
© 2024 Benzinga.com. Benzinga does not provide investment advice. All rights reserved.