Salesforce CRM is preparing to release its quarterly earnings on Tuesday, 2024-12-03. Here’s a brief overview of what investors should keep in mind before the announcement.
Analysts expect Salesforce to report an earnings per share (EPS) of $2.44.
The market awaits Salesforce’s announcement, with hopes high for news of surpassing estimates and providing upbeat guidance for the next quarter.
It’s important for new investors to understand that guidance can be a significant driver of stock prices.
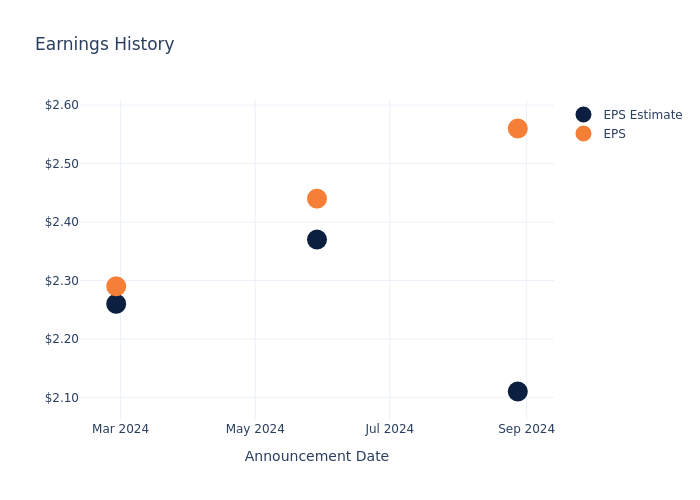
Earnings History Snapshot
The company’s EPS beat by $0.45 in the last quarter, leading to a 0.73% drop in the share price on the following day.
Here’s a look at Salesforce’s past performance and the resulting price change:
| Quarter | Q2 2025 | Q1 2025 | Q4 2024 | Q3 2024 |
|---|---|---|---|---|
| EPS Estimate | 2.11 | 2.37 | 2.26 | 1.88 |
| EPS Actual | 2.56 | 2.44 | 2.29 | 2.11 |
| Price Change % | -1.0% | -20.0% | 3.0% | 9.0% |

Tracking Salesforce’s Stock Performance
Shares of Salesforce were trading at $329.99 as of November 29. Over the last 52-week period, shares are up 32.59%. Given that these returns are generally positive, long-term shareholders are likely bullish going into this earnings release.
Analysts’ Take on Salesforce
For investors, staying informed about market sentiments and expectations in the industry is paramount. This analysis provides an exploration of the latest insights on Salesforce.
The consensus rating for Salesforce is Outperform, based on 26 analyst ratings. With an average one-year price target of $357.42, there’s a potential 8.31% upside.
Understanding Analyst Ratings Among Peers
In this analysis, we delve into the analyst ratings and average 1-year price targets of SAP, Adobe and Intuit, three key industry players, offering insights into their relative performance expectations and market positioning.
- Analysts currently favor an Outperform trajectory for SAP, with an average 1-year price target of $266.4, suggesting a potential 19.27% downside.
- For Adobe, analysts project an Outperform trajectory, with an average 1-year price target of $627.77, indicating a potential 90.24% upside.
- Intuit is maintaining an Outperform status according to analysts, with an average 1-year price target of $744.09, indicating a potential 125.49% upside.
Snapshot: Peer Analysis
The peer analysis summary offers a detailed examination of key metrics for SAP, Adobe and Intuit, providing valuable insights into their respective standings within the industry and their market positions and comparative performance.
| Company | Consensus | Revenue Growth | Gross Profit | Return on Equity |
|---|---|---|---|---|
| Salesforce | Outperform | 8.39% | $7.17B | 2.44% |
| SAP | Outperform | 9.38% | $6.21B | 3.53% |
| Adobe | Outperform | 10.59% | $4.85B | 11.46% |
| Intuit | Outperform | 10.24% | $2.46B | 1.08% |
Key Takeaway:
Salesforce ranks at the top for Gross Profit and Return on Equity among its peers. It is in the middle for Revenue Growth.
Get to Know Salesforce Better
Salesforce provides enterprise cloud computing solutions. The company offers customer relationship management technology that brings companies and customers together. Its Customer 360 platform helps the group to deliver a single source of truth, connecting customer data across systems, apps, and devices to help companies sell, service, market, and conduct commerce. It also offers Service Cloud for customer support, Marketing Cloud for digital marketing campaigns, Commerce Cloud as an e-commerce engine, the Salesforce Platform, which allows enterprises to build applications, and other solutions, such as MuleSoft for data integration.
A Deep Dive into Salesforce’s Financials
Market Capitalization Analysis: The company’s market capitalization is above the industry average, indicating that it is relatively larger in size compared to peers. This may suggest a higher level of investor confidence and market recognition.
Revenue Growth: Over the 3 months period, Salesforce showcased positive performance, achieving a revenue growth rate of 8.39% as of 31 July, 2024. This reflects a substantial increase in the company’s top-line earnings. In comparison to its industry peers, the company trails behind with a growth rate lower than the average among peers in the Information Technology sector.
Net Margin: Salesforce’s net margin surpasses industry standards, highlighting the company’s exceptional financial performance. With an impressive 15.32% net margin, the company effectively manages costs and achieves strong profitability.
Return on Equity (ROE): The company’s ROE is below industry benchmarks, signaling potential difficulties in efficiently using equity capital. With an ROE of 2.44%, the company may need to address challenges in generating satisfactory returns for shareholders.
Return on Assets (ROA): Salesforce’s ROA lags behind industry averages, suggesting challenges in maximizing returns from its assets. With an ROA of 1.52%, the company may face hurdles in achieving optimal financial performance.
Debt Management: The company maintains a balanced debt approach with a debt-to-equity ratio below industry norms, standing at 0.2.
To track all earnings releases for Salesforce visit their earnings calendar on our site.
This article was generated by Benzinga’s automated content engine and reviewed by an editor.
© 2024 Benzinga.com. Benzinga does not provide investment advice. All rights reserved.


